Uber Forecast: UBER Coils Above $68 With $79 as the Breakout Trigger
Uber Forecast: A Compressed Valuation Meeting a Compressed Chart
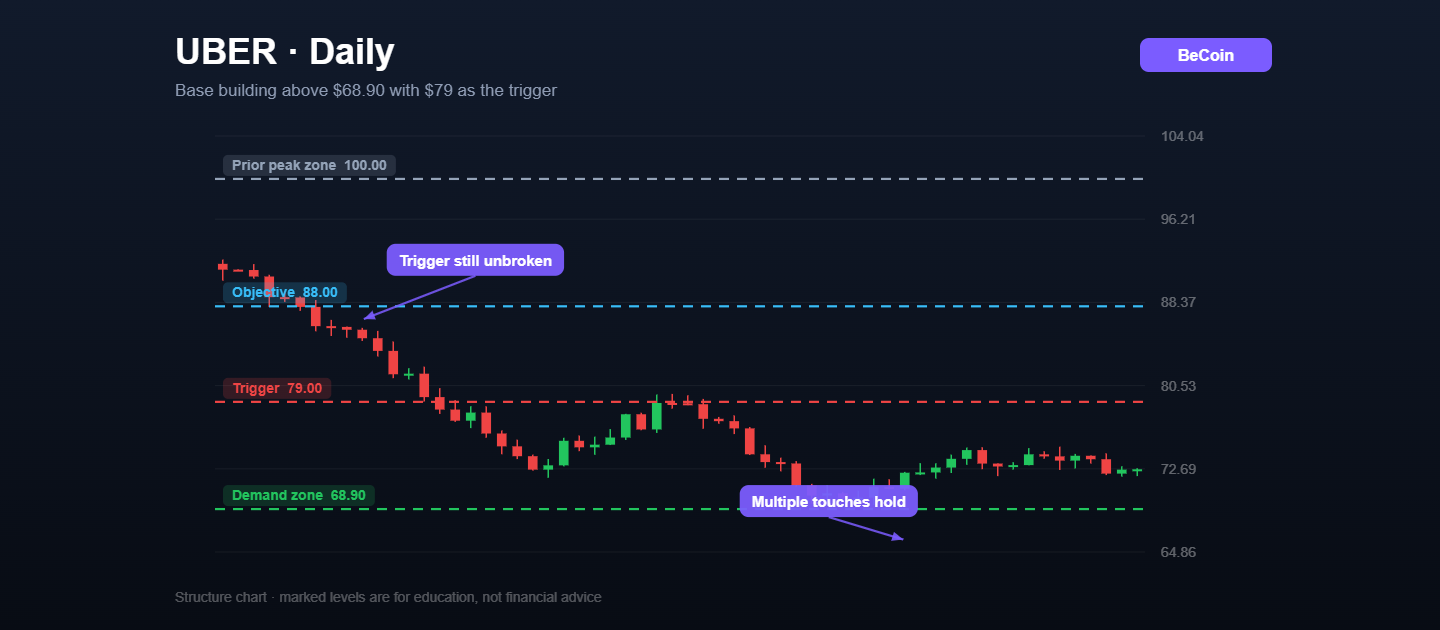
Uber is trading roughly 27% below the peak it set last autumn near $102, and the decline has flattened out rather than accelerated. Price has spent weeks rotating in a narrowing band above $68.90, a demand zone that has now been tested several times without giving way. Multi-touch support that refuses to break is usually a sign that supply is exhausting, though it takes a trigger to convert that into an actual trend.
The $68.90 Zone and Why It Keeps Holding
Each visit to that area has produced a longer lower wick and a faster recovery, which is the signature of accumulation rather than distribution. Long setups published around the stock place invalidation just below $68.50, and the $70 to $75 band is where the more patient accumulation ideas are anchored. The consistency of the level is the point: buyers are not chasing, they are waiting at a price and being filled.
$79 Is the Line That Changes the Chart
The whole recovery case runs through the $78.76 to $81 band. That is where the 50-day average, the top of the current range and the last failed rally all sit. A daily close above it turns the triple-bottom structure into a confirmed reversal and opens the door toward $88, with the $100 to $102 prior peak as the longer-horizon objective. Until then, every rally into the high $70s is a level to respect rather than to chase.
What the Business Is Actually Doing
The gap between Uber's price action and its financial trajectory is the interesting part. Free cash flow generation has continued improving, the mobility and delivery segments have both been contributing rather than one subsidising the other, and the market has still de-rated the stock. Some of that reflects genuine uncertainty about autonomous vehicle competition and what it does to the driver-supply model over the next decade. Some of it is simply rotation out of the growth complex. Those two explanations imply very different fair values, which is why opinions on this name are unusually divided.
How to Structure a Position
The patient approach accumulates between $69 and $75 with a stop beneath $68.50 and objectives at $79 and then $88. The momentum approach waits for the daily close above $78.76 and targets $88.70, accepting the worse entry. There is also a credible bearish case: several published setups look for a break of the demand zone and a slide toward $60. That scenario deserves respect rather than dismissal, and it is the reason the stop matters more than the target here. For level tracking that updates with the structure, Becoin.net Premium Forecast follows UBER with the rest of the large-cap tech group, and Becoin.net Tariff Plans explains which tier fits a position-trading horizon.
The Invalidation
A daily close beneath $68.50 removes the base, exposes the $64 area and makes the $60 target a live possibility rather than a bearish talking point.

Finding My Perfect Workspace: The Search for the Best Broker for My Daily Trading Routine
The alarm goes off at 6:00 AM. By 6:30 AM, I am sitting in front of my monitors with a steaming mug of black coffee. The house is completely quiet, the market is preparing its next major move, and my charts are completely bare. This is my daily sanctuary. For a long time, this morning […]

WTI reaches $89.43 as Brent clears $95 on renewed supply risk
WTI traded near $89.43 while Brent moved above $95 as Middle East shipping risk lifted crude for a fifth session. Key levels, catalysts and invalidation.

Bitcoin slips to $65,741 as oil and yields test the breakout
Bitcoin is near $65,741 as rising oil and Treasury yields test the $65.7K breakout floor. Here are the levels that confirm or invalidate the move.

How Liquidity Affects Day Trading Results
When I first started trading day trading, I believed success was all about finding the perfect indicator. I spent weeks testing moving averages, RSI settings, support and resistance levels, and dozens of YouTube strategies that promised easy wins. Some worked for a few trades, but most failed. What confused me was that the same setup […]

Best Broker for Learning Price Action in 2026 (Tested by Real Traders)
Most traders think they need a better strategy. What they actually need is a better understanding of price. A few years ago, one of our community members had over ten indicators on his chart. RSI. MACD. Moving averages. Bollinger Bands. Stochastic. Every new YouTube video added another indicator. The result? More confusion. Not more profits. […]

Binomo Verification (KYC) for First Withdrawal: Exact Documents That Usually Trigger Rejection
The first time I tried to withdraw from Binomo, I was not worried about the trade. I was worried about the paperwork. That probably sounds strange if you are new. Most traders obsess over entries, expiry times, payout percentages, and strategy screenshots. I did too. But the moment I clicked my first withdrawal request, the […]