TLT holds at $83.25 as long-duration bonds confront higher yields
# TLT holds at $83.25 as long-duration bonds confront higher yields
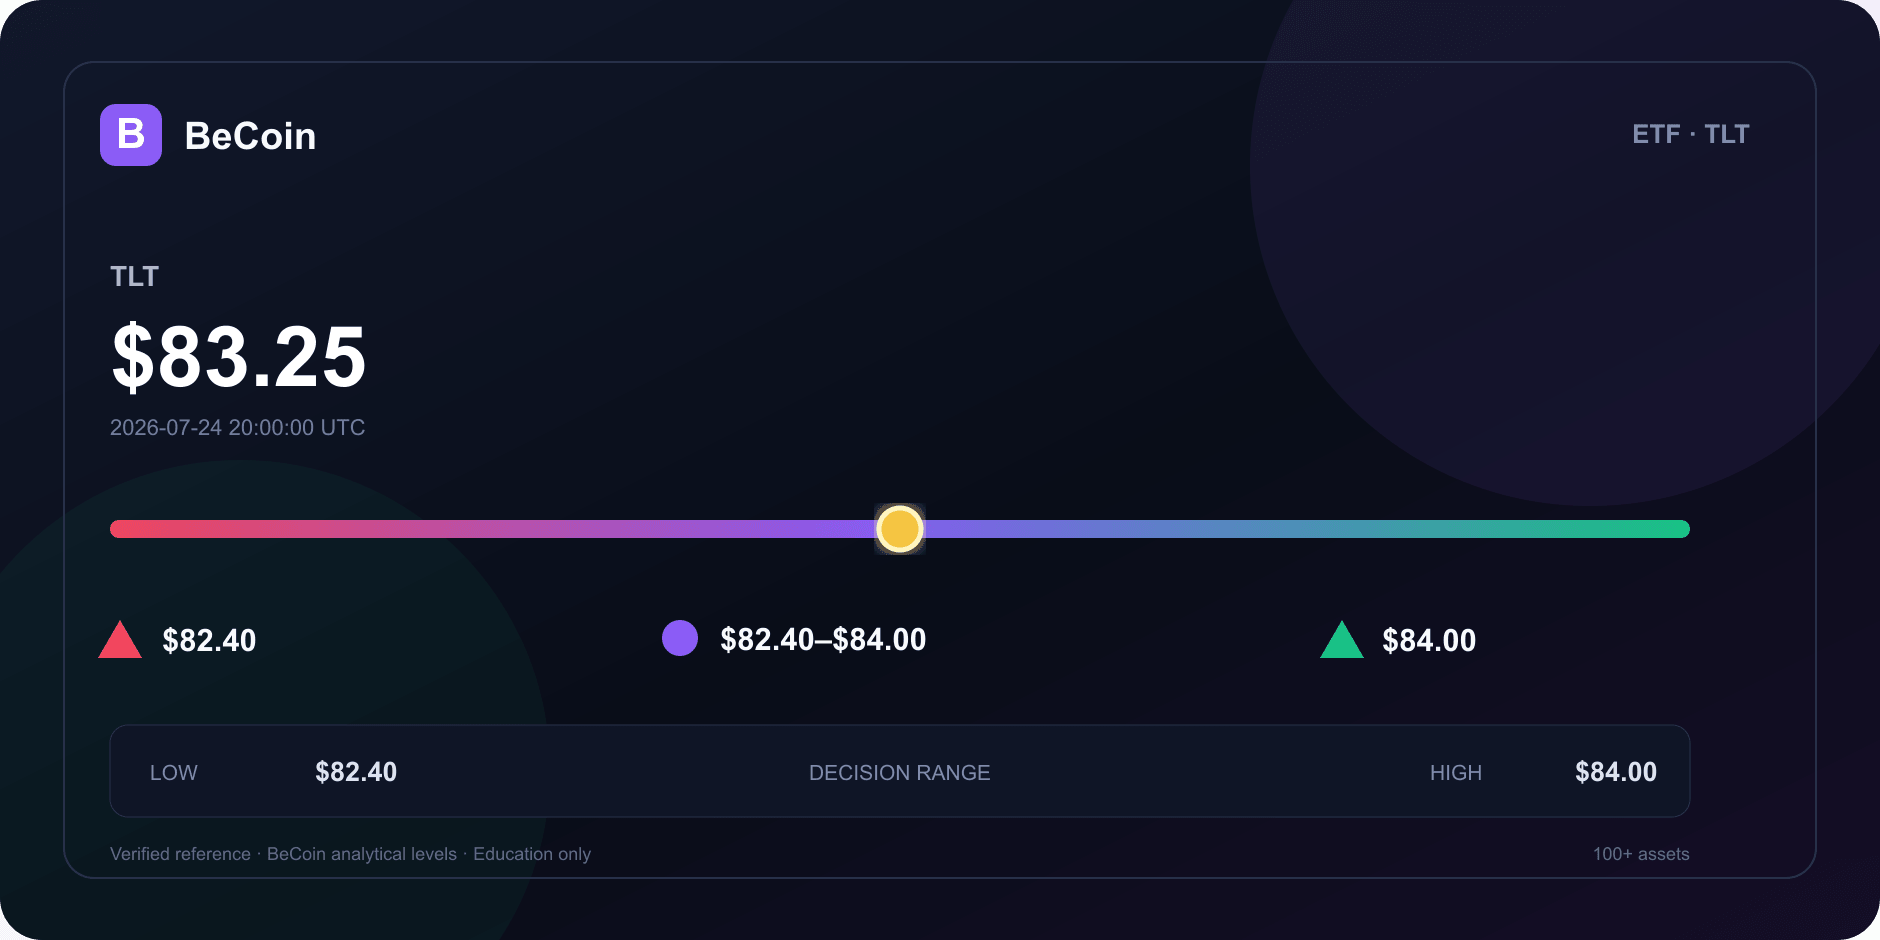
As of the latest update, the iShares 20+ Year Treasury Bond ETF (TLT) is priced at $83.25, reflecting a minor increase of 0.10% at the regular-session close. This price is situated within a defined range of $82.40–$84.00, which serves as a critical analytical framework for assessing TLT's market behavior.
Why it matters
The current valuation of TLT is significant as it represents the market's response to ongoing fluctuations in long-duration bond yields. Investors are keenly observing how these yield dynamics may influence TLT's attractiveness as a long-term investment vehicle. The market debate may center on whether the current yield levels can sustain TLT's performance or if a shift in investor sentiment is on the horizon.
Technical and market context
Recent data from Google Finance indicates that TLT was trading at $83.25 as of July 24, 2026. This price point is critical as it aligns with the established range of $82.40–$84.00. The upper bound of this range, $84.00, may serve as a potential resistance level, while the lower bound, $82.40, could act as support. The recent TradingView ideas suggest a leaning towards long positions, with demand noted near the $82.40–$83.20 range. However, these insights are framed within personal options strategies and should not be interpreted as definitive BeCoin guidance.
BeCoin forecast read
The forecast for TLT can be viewed through two potential scenarios. In a bullish scenario, if TLT can break above the $84.00 level, it may indicate a stronger demand for long-duration bonds, potentially leading to further price appreciation. Conversely, in a bearish scenario, a decline below the $82.40 support level could signal a shift in market sentiment, prompting a reevaluation of TLT's attractiveness. The market may continue to debate the implications of these yield levels on TLT's future performance.
Methodology and sources
The analysis presented here is based on verified market data and established analytical levels. The reference price of $83.25 is sourced from Google Finance, while the range of $82.40–$84.00 is derived from BeCoin's analytical framework. For further insights, the official iShares TLT product page provides additional context on the ETF's structure and performance metrics.
Related market analysis · Related BeCoin tool
Google Finance quote · iShares TLT product page · TradingView ideas
| Evidence field | Value |
|---|---|
| Verified reference | $83.25 |
| Source time | 2026-07-24 20:00:00 UTC |
| Base range | $82.40–$84.00 |
| Bull confirmation | $84.00 |
| Bear confirmation | $82.40 |
This content is for education only and is not financial advice.
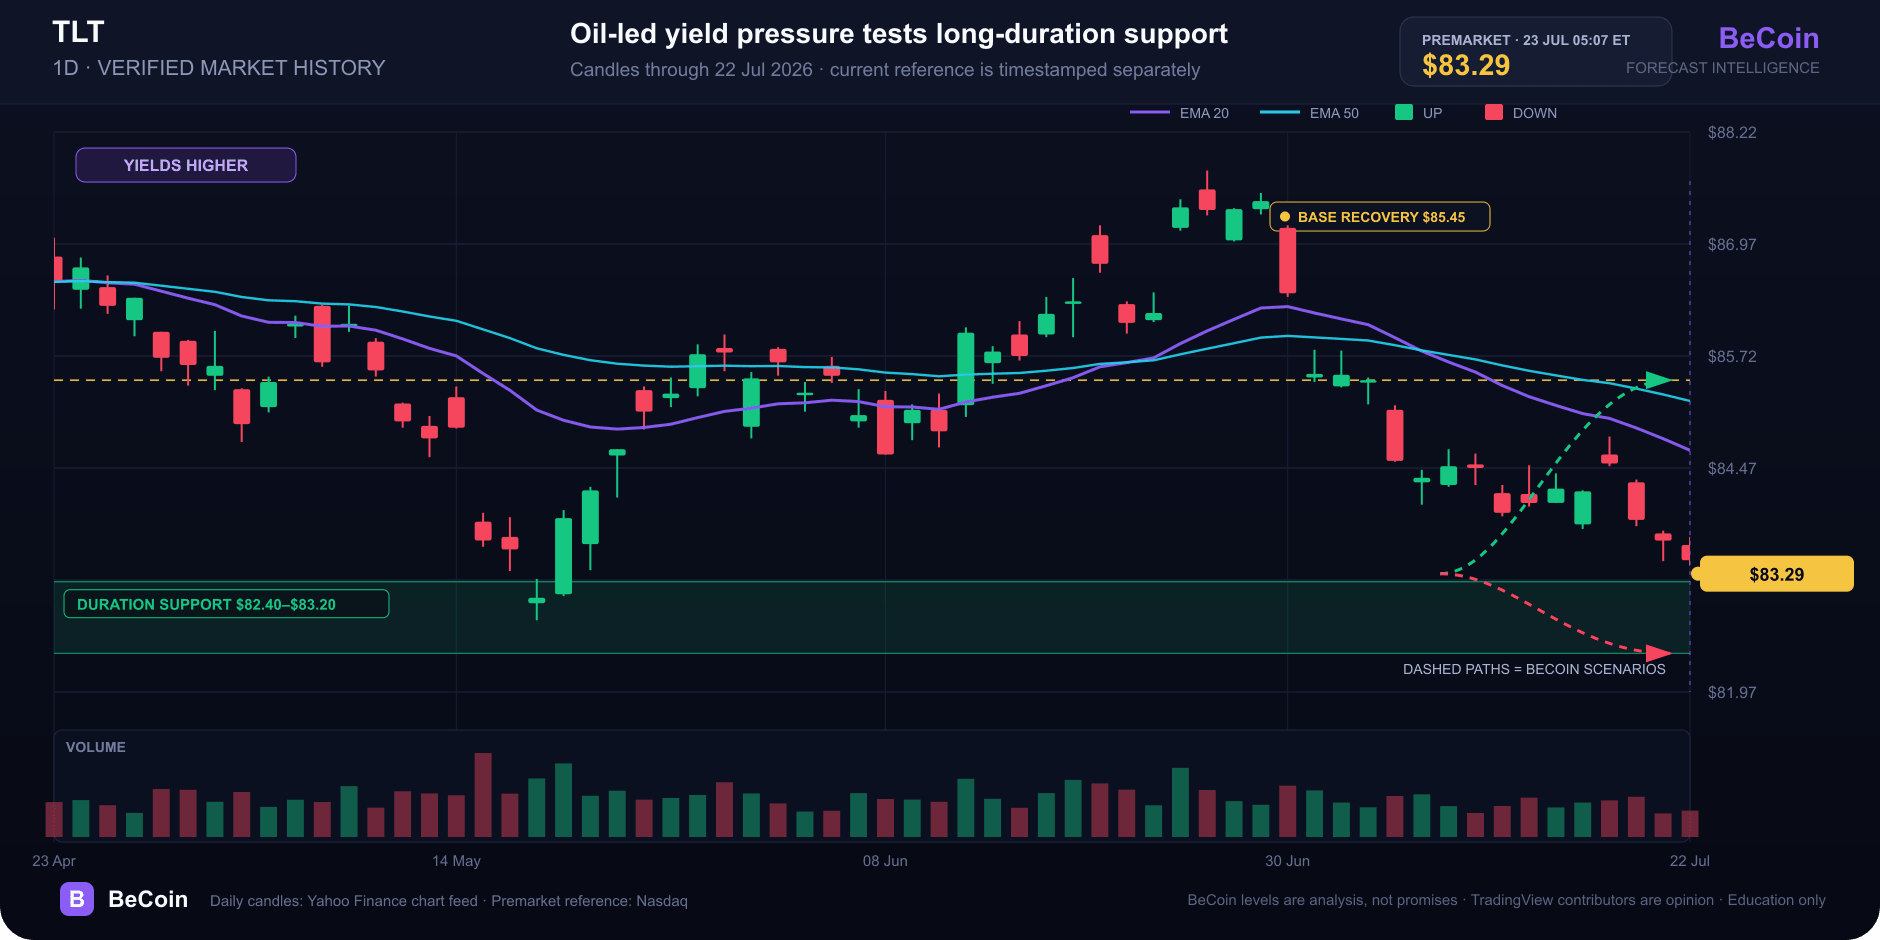
TLT slips to $83.29 as oil pushes long-duration risk back into focus
TLT traded near $83.29 premarket as oil and Treasury yields rose. Here is why duration matters and which levels separate a base from a breakdown.

The Clock and the Cash: My Journey into the Hidden Rhythm of Session-Based Trading
There was a time when I thought the global financial market was a single, monstrous wave that never stopped moving. I believed that if I sat in front of my monitors long enough, clicking buttons whenever a pretty pattern appeared on my charts, the market would eventually reward my sheer endurance. I was dead wrong. […]

Bitcoin slips to $65,741 as oil and yields test the breakout
Bitcoin is near $65,741 as rising oil and Treasury yields test the $65.7K breakout floor. Here are the levels that confirm or invalidate the move.

How Understanding Market Structure Saved My Binary Options Trading
I remember the exact moment my trading account hit zero for the third time in a single month. It was a rainy Tuesday evening, and I was staring at a 1-minute chart on my laptop screen. The price had been moving up aggressively. It looked like a flawless rocket ship to the moon. I clicked […]

Why Market Open Hours Create the Best Trading Opportunities
I used to think trading was a 24-hour conveyor belt of endless cash. In my earliest days, armed with a laptop, a hot cup of coffee, and far too much unearned confidence, I would stare at charts at 11:00 PM on a Tuesday. The candles barely moved. They crawled across my screen like snails on […]

The Clock and the Candle: How I Stopped Guessing the Best Time to Trade Binary Options
I still remember the night I blew my third trading account. It was 11:30 PM. The house was completely quiet, the market charts on my screen were barely crawling, and I was forcing trades out of pure impatience. I kept staring at a flatline asset, placing one-minute positions, convinced that the market owed me a […]