Solana Has Built a Higher-Low Structure — Now It Has to Get Through 77
Structure first, opinion second
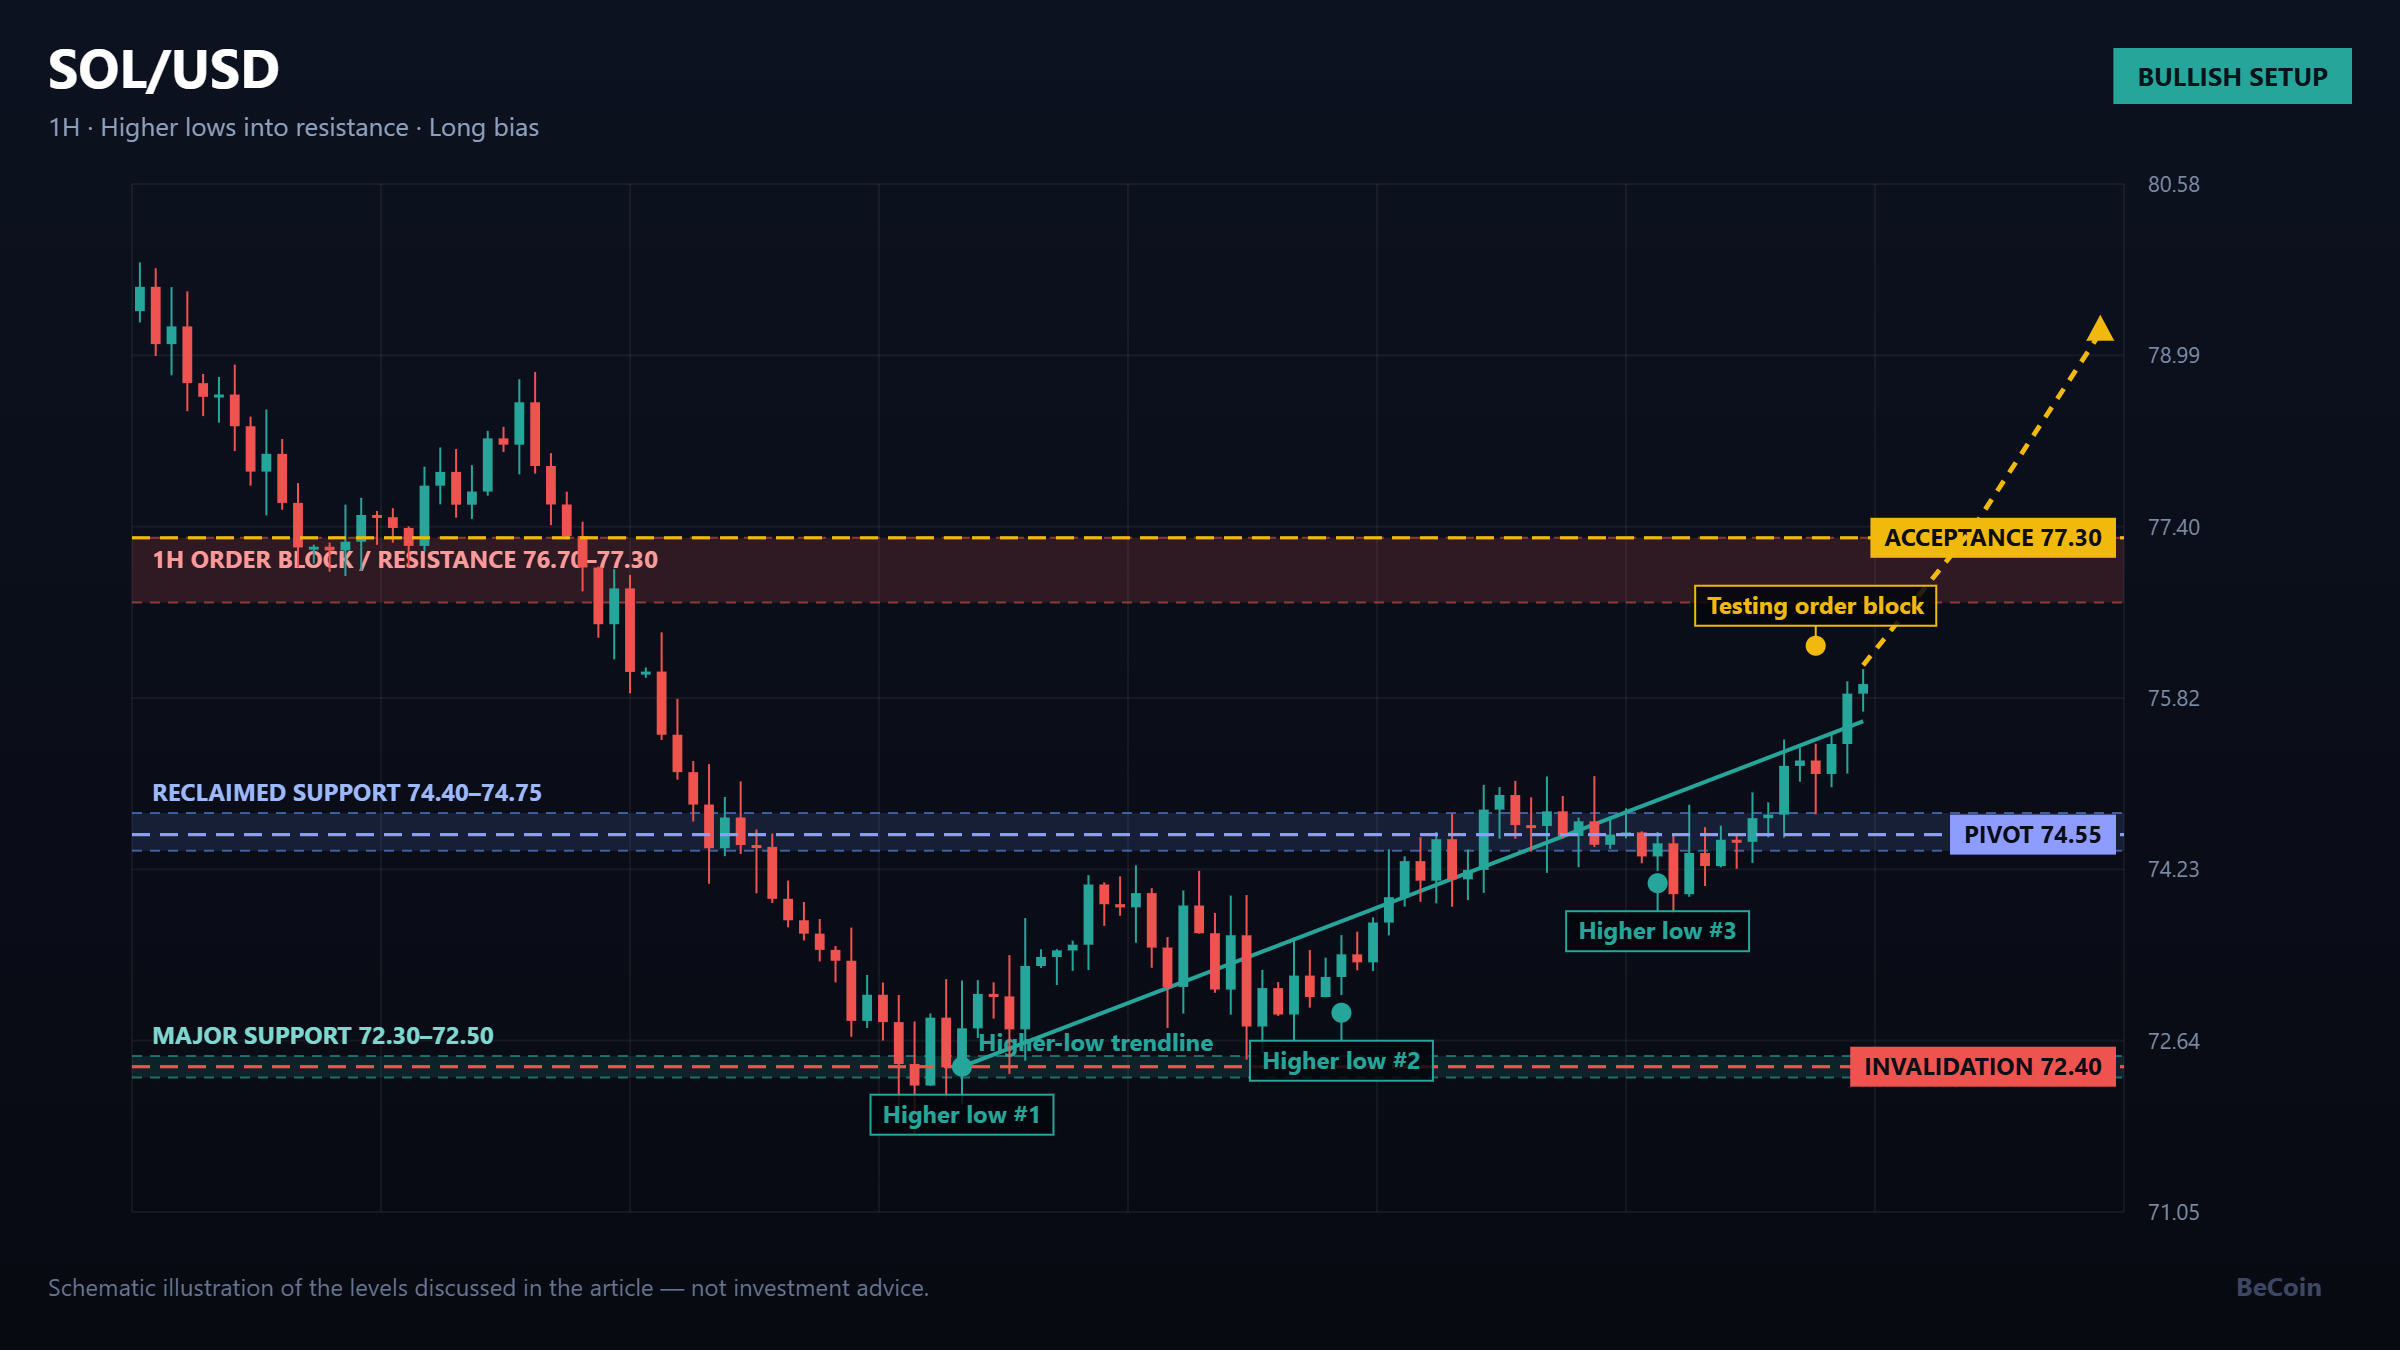
Solana has quietly done the thing that matters. After reacting off the 72.30 to 72.50 support area, it has put in a series of higher lows and pushed back through the 74.40 to 74.75 band that had been capping it. That band is now the first level of defence rather than an obstacle, and that single change is what makes the current chart worth taking seriously.
None of this makes SOL a buy at any price. It makes the sequence coherent, which is a lower bar than most crypto charts clear.
The Solana map as it stands
Price is trading around the 76 handle, approaching the marked resistance and order block region between 76.70 and 77.30. Below, the two levels that matter are the reclaimed 74.40 to 74.75 area and the deeper 72.30 to 72.50 base. That gives a very tidy three-tier structure: base, pivot, ceiling.
The 76.70 to 77.30 zone is where earlier supply appeared, which is why it is drawn as an order block rather than a single line. Supply zones are ranges because institutional selling is rarely executed at one price.
If buyers win
The bullish continuation requires acceptance above 77.30, and acceptance is a specific thing: closes above the level, followed by a pullback that does not fall back inside the zone. Assuming rather than confirming a breakout is how most traders donate money to the market in this exact situation.
With acceptance established, the higher-low structure remains intact and price has room to explore levels that have not been visited since the decline began. The reclaimed 74.40 area then becomes the logical trailing reference for anyone managing an existing position.
If sellers win
Rejection at 76.70 to 77.30 is the more mundane outcome and would put the reclaimed 74.40 to 74.75 area straight back under pressure. Losing that band would break the higher-low sequence and reopen the 72.30 to 72.50 base as a target. Below the base, the short-term bullish argument is simply gone.
Notably, a failed breakout here would also trap late buyers above 77, which tends to accelerate the move down as those positions are cut.
The behaviour to watch, not the price
The useful information over the next few sessions is not where SOL trades but how it trades. Slow, overlapping candles pressing into the zone suggest absorption and favour a break. Sharp spikes into the zone followed by immediate reversal candles favour rejection. Volume expansion on the break, or the absence of it, settles the argument.
Bottom line
Solana has a genuine short-term bullish structure built on higher lows from 72.30 and a reclaim of 74.40. The 76.70 to 77.30 order block is the test. Acceptance above it keeps the structure alive; rejection puts 74.40 and then 72.30 back in play. Everything else is commentary.
Becoin.net Premium Forecast - Becoin.net Tariff Plans
This article is educational market commentary and is not investment advice. Cryptocurrency markets are volatile; trade your own plan and manage risk accordingly.

Which Broker Has the Cleanest Interface? Real Comparison for Beginners in 2026
Looking for the cleanest trading interface in 2026? Compare Binomo, IQ Option, Quotex, Deriv, and more based on speed, layout, usability, mobile experience, and beginner friendliness. When most beginners choose a broker, they focus on bonuses, payouts, or deposit methods. But after testing multiple platforms for months, I realized something surprising: A messy interface can […]

Is Capital Core Safe or a Scam? What Day Traders Should Know Before Depositing
I’ll be honest: the first time I landed on Capital Core, I didn’t feel excited. I felt suspicious. That might sound strange coming from someone who has spent years around day trading and offshore brokers, but if you’ve traded long enough, you know the pattern. A polished homepage. Big payout claims. A low minimum deposit. […]

Capital Core Withdrawal Test: How Long Does It Really Take to Get Paid?
If you are thinking about using Capital Core, ignore the flashy payout claims for a minute. The only thing that really matters is whether the broker pays you when you request a withdrawal. That was the exact reason I decided to test it for myself. I wasn’t interested in another recycled broker review built around […]

EUR/USD holds 1.1414 before the ECB decision: three scenarios
EUR/USD traded near 1.1414 before the ECB’s July decision. Here is what a hold, hawkish hold or surprise hike could mean for 1.1350 and 1.1480.

How Understanding Market Structure Saved My Day Trading
I remember the exact moment my trading account hit zero for the third time in a single month. It was a rainy Tuesday evening, and I was staring at a 1-minute chart on my laptop screen. The price had been moving up aggressively. It looked like a flawless rocket ship to the moon. I clicked […]

How I Learned to Sit on My Hands During Choppy Markets
I remember the morning vividly. It was a Tuesday. The coffee on my desk was still piping hot, the charts on my screen were blinking, and I was feeling incredibly confident. I had just finished reading about how market open hours create the best trading opportunities, and I was ready to hunt for a clean […]