Solana Coils Below Its Daily Averages Again — The $45 Scenario Explained
A pattern that has repeated three times
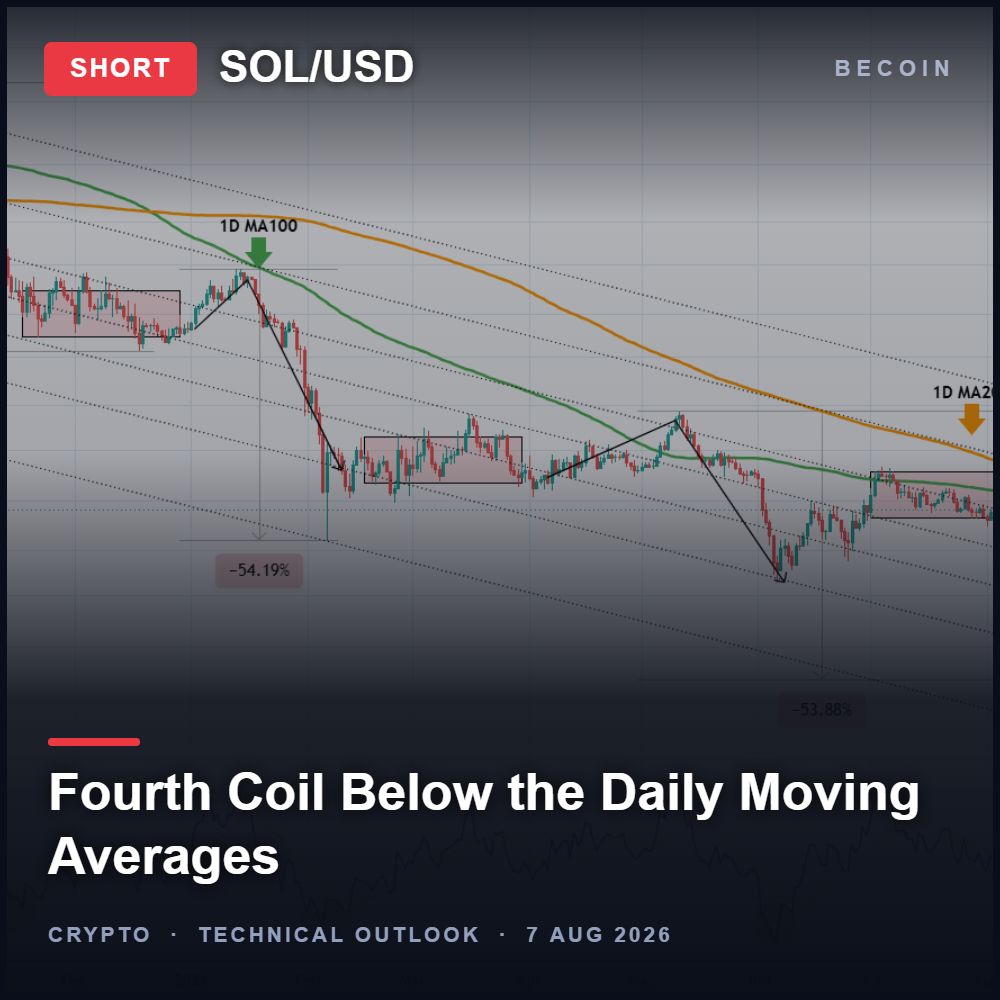
Solana is trading near $74 and has spent almost exactly one month going sideways beneath its daily moving averages, inside the descending Fibonacci channel that has framed price action since the September 2025 high. What makes this interesting is not the consolidation itself but its history. This is the fourth time the same configuration has appeared within the current structure, and the previous three all resolved the same way.
What happened the last three times
On each prior occasion, the sideways phase gave way to a decisive decline that carried price down to at least the lower Fibonacci band of the channel, with the daily RSI pushing through the oversold threshold in the process. That consistency is the backbone of the bearish case put forward . Patterns that repeat inside the same structure deserve more weight than patterns spotted in isolation, because the market context has not changed between occurrences.
The resistance that keeps holding
Overhead, the daily 200-period moving average has capped every advance since early November 2025 and continues to slope downward. Price is also pinned beneath the 100-period average. When a market cannot reclaim either of its primary daily averages over a period of months, the burden of proof sits squarely with buyers. Consolidation under falling resistance is usually distribution, not accumulation.
The downside scenario
If the pattern rhymes again, the projected move points toward the $45.50 region, which corresponds with the lower Fibonacci reference of the channel and would represent a decline of roughly fifty percent from current levels. That is a large number, but it is proportionate to the moves that followed each of the previous three consolidations. The practical refinement is to treat oversold RSI as an exit trigger rather than waiting for the exact price target, since momentum extremes often mark where these legs exhaust.
What would invalidate it
A sustained daily close above the moving-average cluster, and particularly a reclaim of the descending channel, would break the repetition and force a rethink. Bear structures that fail after four attempts tend to fail quickly, so the invalidation should be respected rather than argued with. Anyone positioning short should also be aware that altcoins can rally violently on Bitcoin strength regardless of their own charts.
Bottom line
Solana is in the same coil that has preceded three separate declines, still capped by falling daily averages and still inside a downward channel. The base case leans lower toward $45.50, with oversold momentum as the more practical exit. A reclaim of the averages ends the argument. This is analysis, not investment advice.

How Liquidity Affects Day Trading Results
When I first started trading day trading, I believed success was all about finding the perfect indicator. I spent weeks testing moving averages, RSI settings, support and resistance levels, and dozens of YouTube strategies that promised easy wins. Some worked for a few trades, but most failed. What confused me was that the same setup […]

How Understanding Market Structure Saved My Day Trading
I remember the exact moment my trading account hit zero for the third time in a single month. It was a rainy Tuesday evening, and I was staring at a 1-minute chart on my laptop screen. The price had been moving up aggressively. It looked like a flawless rocket ship to the moon. I clicked […]

Why Most Deriv Traders Blow Accounts: A Data-Driven Post-Mortem Analysis
The first time I blew a trading account on Deriv, it didn’t happen dramatically. There was no single catastrophic trade. It happened quietly. One loss turned into another. Then I increased the stake to recover the loss. Then the market moved again. Before I realized what had happened, an account balance that took weeks to […]

Trading Currency Strength Instead of Single Pairs
It was a Tuesday afternoon when I realized I was fighting a losing battle against a ghost. My screen was a chaotic web of indicators. I had the EUR/USD chart open, a moving average crossing over here, a relative strength index flashing oversold there, and a price action setup that looked textbook perfect. I clicked […]

The Clock and the Cash: My Journey into the Hidden Rhythm of Session-Based Trading
There was a time when I thought the global financial market was a single, monstrous wave that never stopped moving. I believed that if I sat in front of my monitors long enough, clicking buttons whenever a pretty pattern appeared on my charts, the market would eventually reward my sheer endurance. I was dead wrong. […]

The Day I Stopped Trading and Finally Started Making Money
It was a rainy Tuesday morning, and I was staring at my screen with a familiar knot in my stomach. The previous three days had been a slow, agonizing slide into the red. I had given back two weeks of hard-earned profits in less than seventy-two hours. Every asset I clicked on looked like a […]