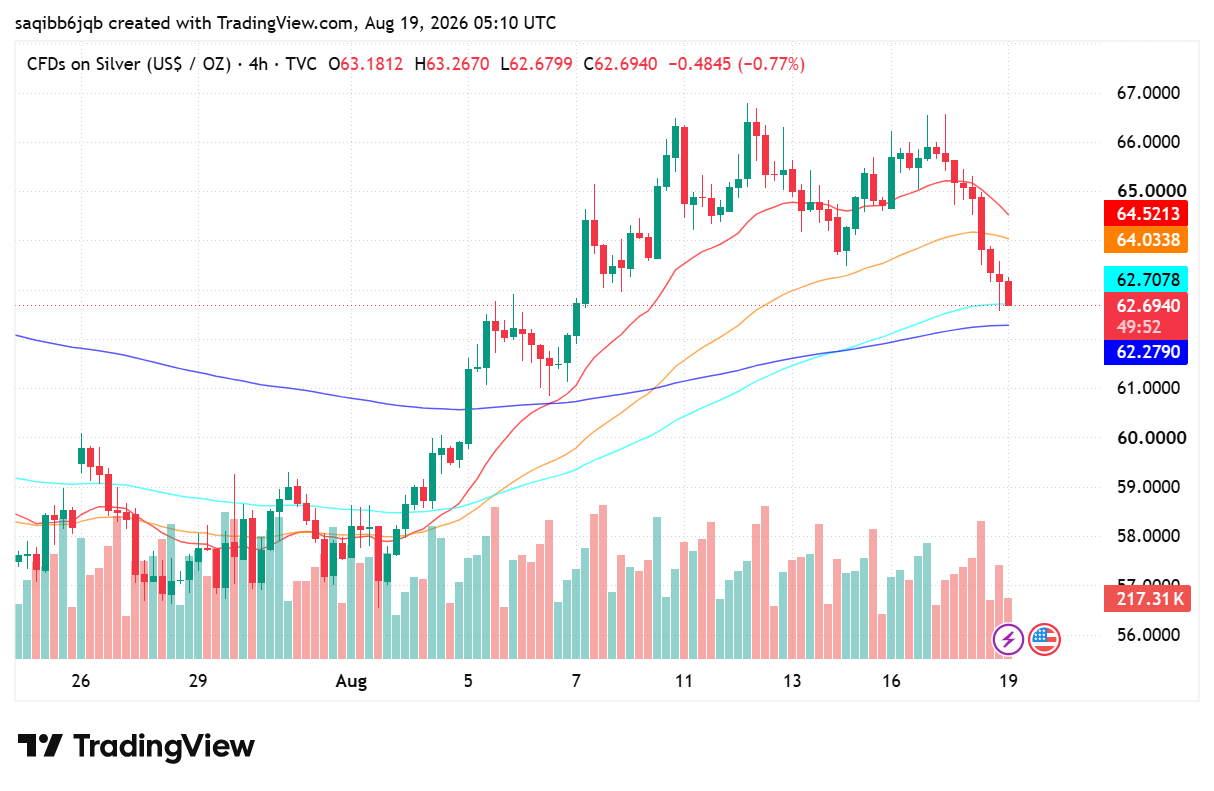
Silver Forecast: XAG/USD Breaks to 62.70 and Tests 62.28
- Silver trades at 62.71, down 0.96% on the day and roughly four dollars below the 66.60 high set on 11 August.
- The gold-to-silver ratio sits near 67:1, with bullion holding above 4,340 while silver gives back its August gains far faster.
- Price is testing the 62.28 moving average, the last piece of structure supporting the summer advance.
Fundamental Analysis: Silver
Silver spent late July and early August running from roughly 57 to 66.60, an advance driven by the same forces lifting gold: a Federal Reserve holding at 3.50–3.75%, July CPI easing to 3.4%, and softer retail sales that pushed markets to price out a September rate increase. Lower expected real yields reduce the carrying cost of precious metals, and silver's smaller market means it moves further on the same flow.
That leverage works in reverse, and it is working in reverse now. Gold has held above 4,340 while silver has surrendered nearly four dollars, taking the ratio back towards 67:1. The reason is silver's industrial half: roughly half of demand is fabrication rather than investment, so it is exposed to the same growth concerns weighing on other cyclical commodities, whereas gold is buttressed by central bank reserve buying that silver does not receive.
That split is the whole fundamental story here. Silver participates fully when the trade is about monetary policy and lags badly when the market starts questioning industrial demand. Until the ratio stabilises, the metal is being priced as a growth asset that happens to be shiny, and its recovery depends less on the Fed than on evidence that manufacturing demand is holding up.
Technical Analysis: Silver
The rally began near 57 in the last days of July and climbed steeply to a 66.60 peak on 11 August, holding a broad 64–66.60 range for the following week. The break came in the last two sessions: price sliced through 64.52 and 64.03 without a pause and closed the latest four-hour bar at 62.70 after a 62.68 low. Both faster averages are now overhead and turning down.
Resistance is 64.03 first, then 64.52, with the 66.60 high beyond. Support is the 62.28 moving average that price is currently sitting on, then 61.00 and the 60.00 handle. A four-hour close below 62.28 removes the last average supporting the advance and invalidates the uptrend, opening the 60.00 area where the July base was built.

How Liquidity Affects Day Trading Results
When I first started trading day trading, I believed success was all about finding the perfect indicator. I spent weeks testing moving averages, RSI settings, support and resistance levels, and dozens of YouTube strategies that promised easy wins. Some worked for a few trades, but most failed. What confused me was that the same setup […]

Trading Currency Strength Instead of Single Pairs
It was a Tuesday afternoon when I realized I was fighting a losing battle against a ghost. My screen was a chaotic web of indicators. I had the EUR/USD chart open, a moving average crossing over here, a relative strength index flashing oversold there, and a price action setup that looked textbook perfect. I clicked […]

IQ Option vs Deriv Chart Comparison
The Night I Realized My Charts Were Lying to Me It was three in the morning, the exact hour when the market looks either like a goldmine or a psychological hazard. I was sitting in front of two monitors, a lukewarm mug of coffee in hand, watching a critical support level on EUR/USD. On my […]

Best Broker for Learning Price Action in 2026 (Tested by Real Traders)
Most traders think they need a better strategy. What they actually need is a better understanding of price. A few years ago, one of our community members had over ten indicators on his chart. RSI. MACD. Moving averages. Bollinger Bands. Stochastic. Every new YouTube video added another indicator. The result? More confusion. Not more profits. […]

Binomo vs IQ Option for Small Accounts: Which Platform Is Better for Beginners in 2026?
Most people entering online trading do not start with thousands of dollars. They start small. Usually with $10, $20, or maybe $50. That small balance changes everything about how a trader behaves. Every loss feels bigger, every win feels emotional, and every mistake has a stronger impact on the account. This is exactly why beginner […]

EUR/USD holds 1.1414 before the ECB decision: three scenarios
EUR/USD traded near 1.1414 before the ECB’s July decision. Here is what a hold, hawkish hold or surprise hike could mean for 1.1350 and 1.1480.