Rocket Lab Forecast: RKLB Tests $74 Support After a 45% Drawdown
Rocket Lab Forecast: The First Real Test of the Trend
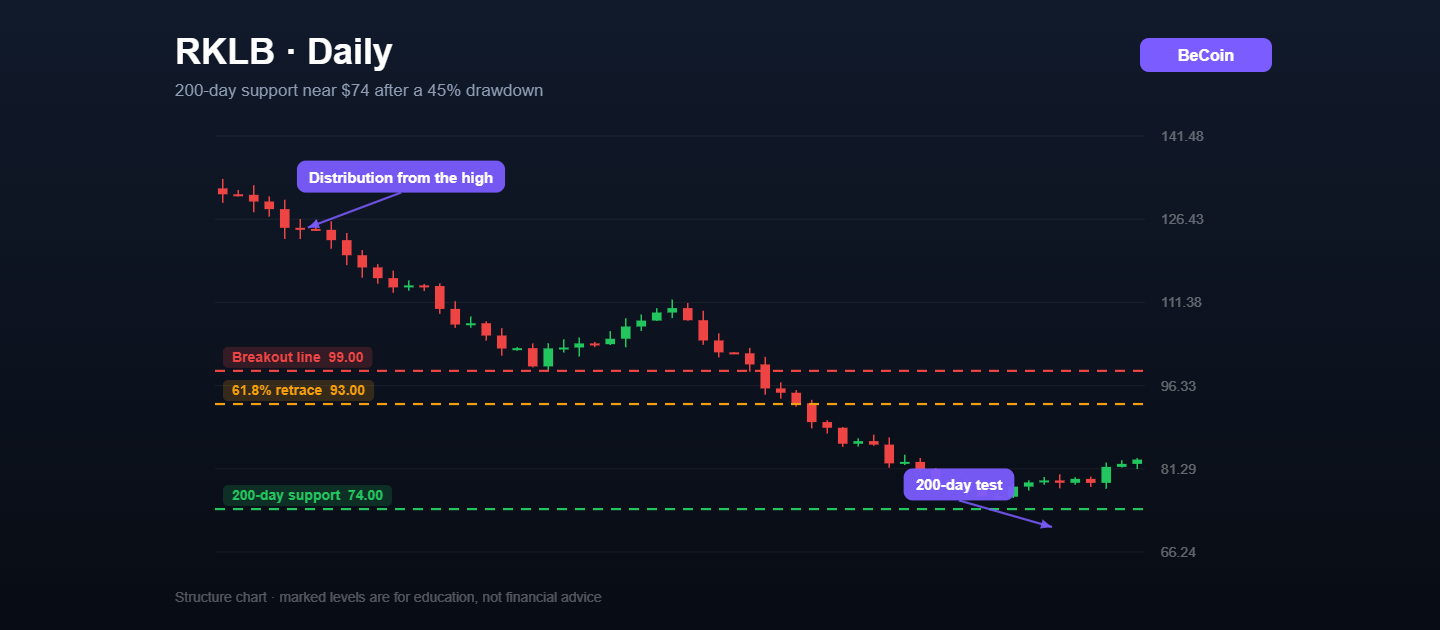
Rocket Lab has fallen roughly 45% from its all-time high near $151, and the decline has been orderly rather than panicked, which is an important distinction. Orderly declines into a well-defined support level tend to resolve differently from disorderly ones. The stock is now sitting on the area where its 200-day simple moving average, a prior swing low and a multi-month horizontal level all converge, somewhere around $73 to $77.
Why the $74 Area Carries So Much Weight
Three things overlap there. The 200-day average, which sits near $74.30 and has not been decisively lost since the trend began. The late-spring low, which acted as the launch point for the last major advance. And a psychological round number that attracts orders regardless of technical merit. Confluence like that does not guarantee a bounce, but it does mean the market has to make a genuine decision rather than drift through the level.
The Levels Above Price
The 61.8% retracement of the entire decline sits near $93, and the golden pocket between $92 and $104 is where most published analysis expects the first serious resistance. Above that, $99 is the line traders keep marking as the breakout trigger, because it is where the last distribution range began. A weekly close above $99 would put the $150 area back into the conversation, though that is a story for later quarters rather than this one.
What Is Actually Driving the Business
Rocket Lab is no longer a pure launch story. The company's proposed acquisition of Iridium, structured roughly half in cash and half in stock, would move a large recurring revenue base onto the balance sheet if it closes as expected. That is a fundamentally different investment case from selling launch capacity by the mission, and the market is still repricing what that means. The Neutron programme timeline remains the other swing factor, and any further slippage there has historically been worth a sharp single-day move.
How Traders Are Framing It
The common structure is accumulation into $73 to $77 with invalidation on a daily close beneath $73, a first objective at $93 and a second at $99. Traders who prefer momentum wait for the reclaim of $99 and give up the cheaper entry in exchange for confirmation that the downtrend has actually ended. What does not work in a name this volatile is averaging down without a defined stop, because a broken 200-day average in a high-beta growth stock rarely stops falling politely. For level updates as the structure develops, Becoin.net Premium Forecast tracks RKLB alongside the wider growth complex, and Becoin.net Tariff Plans lays out which tier fits a swing horizon.
The Invalidation
A daily close beneath $73, particularly on elevated volume, turns the 200-day average into resistance and opens a path toward the $65 area. That is the point where the pullback stops being a pullback.

IQ Option vs Deriv Chart Comparison
The Night I Realized My Charts Were Lying to Me It was three in the morning, the exact hour when the market looks either like a goldmine or a psychological hazard. I was sitting in front of two monitors, a lukewarm mug of coffee in hand, watching a critical support level on EUR/USD. On my […]

Alphabet falls to $329.71 premarket as AI spending eclipses cloud growth
Alphabet traded near $329.71 premarket after strong Q2 revenue and cloud growth collided with a much larger AI spending plan. What investors need to watch.

The Day I Stopped Trading and Finally Started Making Money
It was a rainy Tuesday morning, and I was staring at my screen with a familiar knot in my stomach. The previous three days had been a slow, agonizing slide into the red. I had given back two weeks of hard-earned profits in less than seventy-two hours. Every asset I clicked on looked like a […]

Which Broker Has Better Risk Management Tools?
The burning smell of my own account blowing up is a scent I will never forget. It was a rainy Tuesday afternoon a few years back. I sat huddled over my laptop, watching a currency pair oscillate. Confident, arrogant, and entirely unprotected, I clicked buy. Minutes later, a sudden market spike completely wiped out my […]

Finding My Perfect Workspace: The Search for the Best Broker for My Daily Trading Routine
The alarm goes off at 6:00 AM. By 6:30 AM, I am sitting in front of my monitors with a steaming mug of black coffee. The house is completely quiet, the market is preparing its next major move, and my charts are completely bare. This is my daily sanctuary. For a long time, this morning […]

The Day I Lost My First Ten Dollars: My Hunt for the Best Mobile Trading App for Beginners
I still remember the exact shape of the cloud outside my window when my first live trade ended in the red. It was a crisp morning, and I was sitting on my couch with a lukewarm cup of coffee, staring at a flashing line on my smartphone screen. I had just deposited ten bucks, convinced […]