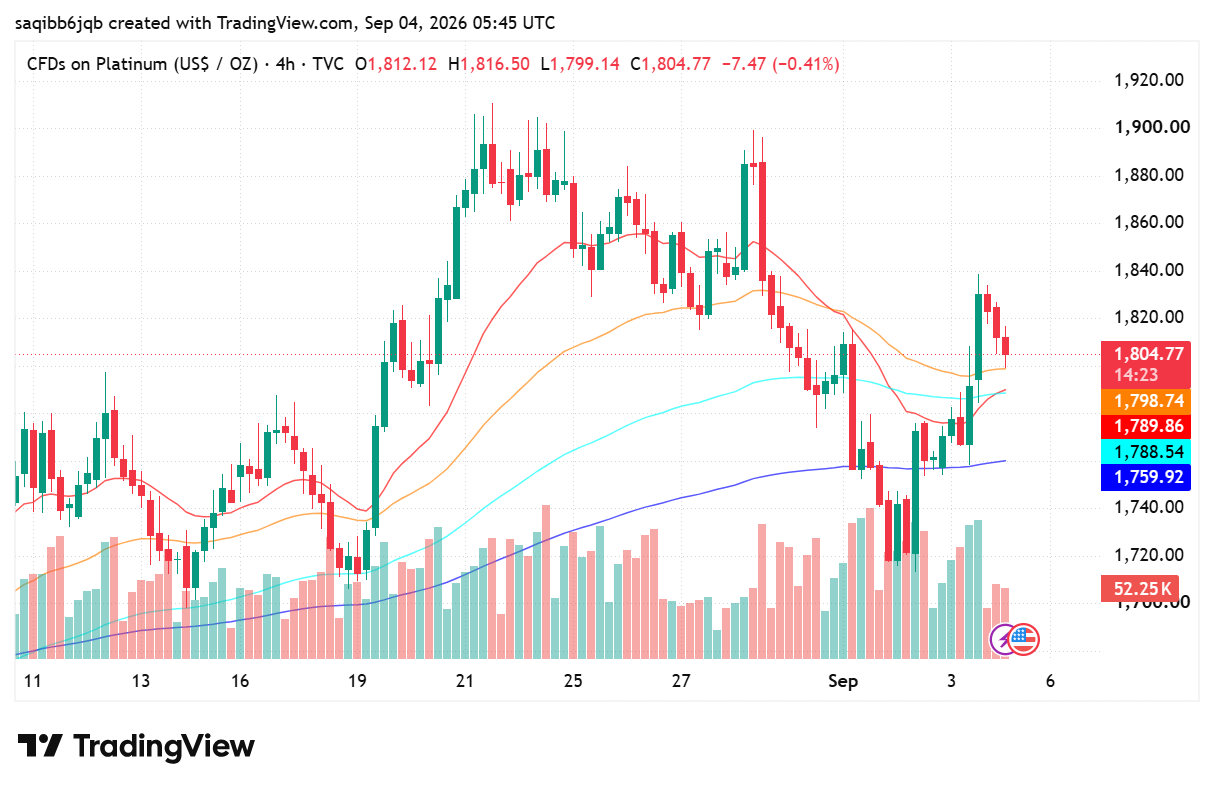
Platinum Forecast: XPT/USD at 1,804 Tests 1,798 Line
- Platinum trades at $1,804.81, down 0.96%, slipping back toward the 1,798.74 average after a failed push at 1,838.
- Rising real yields are the immediate headwind, with ten-year Treasury yields above 4.8%.
- The 1,789.87 average is the level that decides whether the August low comes back into play.
Fundamental Analysis: Platinum
The rate backdrop is doing most of the damage. Markets are pricing roughly a two-thirds probability of a Federal Reserve increase at the September meeting, three FOMC members dissented in July in favour of tightening, and ten-year Treasury yields have climbed above 4.8%. For a metal that pays no coupon and carries storage costs, a rising real yield is a direct and mechanical headwind — it raises the price of holding the position every day it is held.
The offsetting case is industrial rather than monetary, and it is genuinely mixed. Platinum's autocatalyst and industrial demand is tied to the same global activity picture that has supported the wider metals complex — Chilean copper output fell 9.4% year on year in July and Congo's export restrictions have tightened supply chains broadly. But the energy shock cuts the other way: crude above $91 following the disruption to Gulf export flows raises input costs across the industrial base, and the fear that elevated energy prices dampen manufacturing activity is already visible in how base metals have traded.
That leaves platinum caught between a supportive supply story and a demand outlook that higher energy and higher rates are both undermining. The metal's failure to hold above 1,838 after recovering from the 1,745 low is the clearest expression of it — buyers are present at the lows, but there is no conviction bid at the highs. Until the September policy decision resolves the rate question, the range is the trade rather than the direction.
Technical Analysis: Platinum
The 4-hour chart shows a downtrend that has flattened into a range. Price fell from roughly 1,890 in mid-August through a series of lower highs to a 1,745 low, then rallied hard to 1,838 before rolling over again. The moving averages have compressed into a tight band at 1,798.74, 1,789.87 and 1,788.55, with the slower 1,759.92 line below — compression of that kind usually resolves with a directional move rather than more range.
Resistance is the 1,838 recovery high, then the 1,860 area where the August breakdown began. Support is the 1,798.74-1,788.55 average cluster immediately beneath spot, then 1,759.92, with the 1,745 swing low below that. A 4-hour close below 1,788.55 would clear the whole band and invalidate the recovery read.

WTI reaches $89.43 as Brent clears $95 on renewed supply risk
WTI traded near $89.43 while Brent moved above $95 as Middle East shipping risk lifted crude for a fifth session. Key levels, catalysts and invalidation.

Bitcoin slips to $65,741 as oil and yields test the breakout
Bitcoin is near $65,741 as rising oil and Treasury yields test the $65.7K breakout floor. Here are the levels that confirm or invalidate the move.

Which Broker Has the Cleanest Interface? Real Comparison for Beginners in 2026
Looking for the cleanest trading interface in 2026? Compare Binomo, IQ Option, Quotex, Deriv, and more based on speed, layout, usability, mobile experience, and beginner friendliness. When most beginners choose a broker, they focus on bonuses, payouts, or deposit methods. But after testing multiple platforms for months, I realized something surprising: A messy interface can […]

Which Broker Has Faster Withdrawals? Real 2026 Comparison for Traders
When most beginners choose a broker, they focus on bonuses, signals, or flashy interfaces. But after trading for a while, you realize one thing matters more than almost anything else: How fast can you actually withdraw your money? A broker can look perfect until your first withdrawal request gets stuck in “processing” for three days. […]

Best Day Trading Brokers for Beginners (2026) — Fast Decision Guide
If you’re searching for the best day trading brokers for beginners, the real problem isn’t lack of options, it’s choosing the wrong platform and learning that mistake after you deposit. Most beginners don’t fail because of strategy. They fail because they start on a broker that has unclear execution, weak withdrawal behavior, or confusing conditions. […]

EUR/USD holds 1.1414 before the ECB decision: three scenarios
EUR/USD traded near 1.1414 before the ECB’s July decision. Here is what a hold, hawkish hold or surprise hike could mean for 1.1350 and 1.1480.