Oracle Stock Forecast: ORCL Rejected at Its 50-Day Line Near $150
The Oracle stock forecast starts at the 50-day line
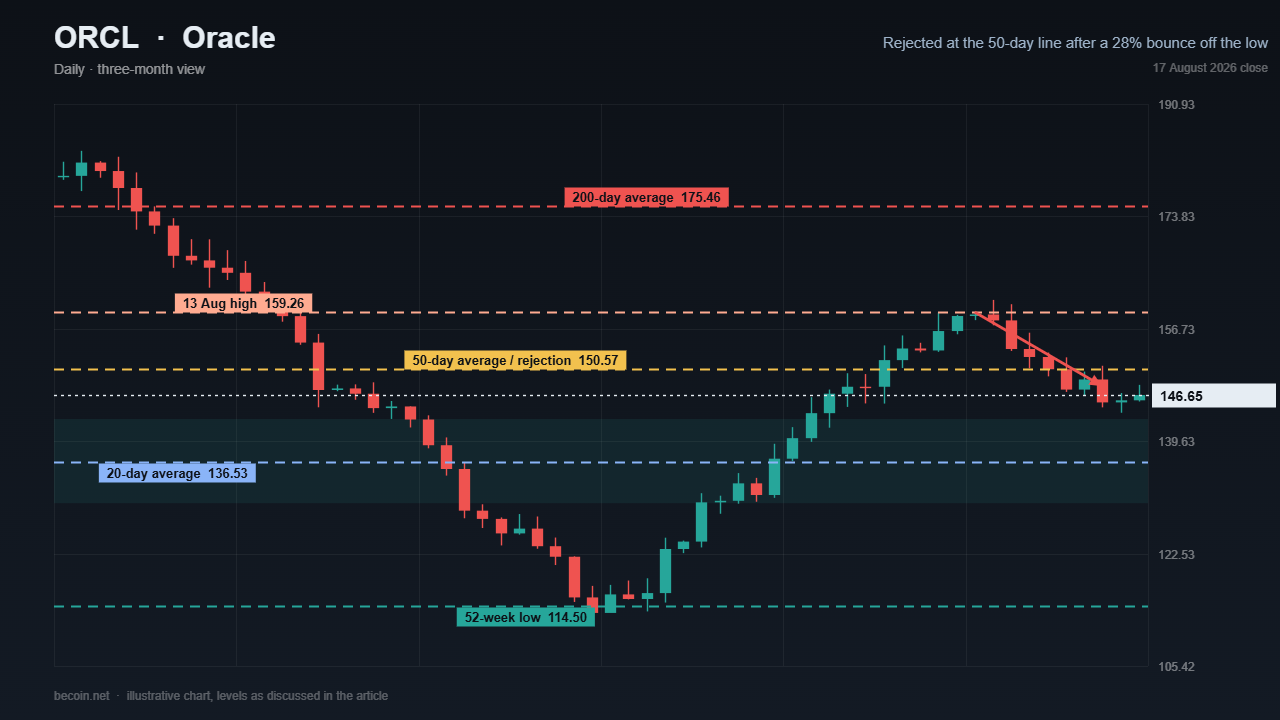
Oracle closed 17 August at $146.65, down 2.6% on the session, after an intraday push to $150.40 failed almost exactly at the 50-day moving average. That is the second time in a week the stock has been turned away from the same area, and it matters because of what came before it: a 28% rally off the $114.50 low set on 28 July.
Bounces of that size out of a capitulation low are common. What separates a bottom from a bear-market rally is whether the first serious moving average gets reclaimed, and so far it has not. The stock trades below both the 50-day at roughly $150.57 and the 200-day at roughly $175.46, with the shorter average about fourteen per cent beneath the longer one — a well-established downtrend rather than a fresh one.
The support shelf runs from $143 down to $130
Below the current price the structure is layered. The first shelf is $142 to $143, the cluster of lows from early August. Beneath that sits the 20-day average near $136.53, which coincides with the gap area from 3 August, and beneath that the $130.20 low that formed the base of the entire rally leg.
Then there is a long drop to $114.50, the 52-week low. That is a wide gap for a company of this size, and it is the reason the $130 area carries so much weight. Losing it would not simply be a lower low; it would open a zone with no meaningful trading history from the last twelve months to slow a decline.
$150 and then $159 have to fall for the picture to change
On the upside the work is well defined. First the 50-day at $150.57, which has now rejected price twice. Then $156 to $159.26, the swing highs from 13 and 14 August. Only above that does the conversation reach the 200-day at $175.46, and a stock has to clear all three before a recovery is more than a bounce.
Context for the drawdown: Oracle is roughly 58% below its 52-week high of $345.72 and down about 41% over twelve months. That is not a wobble in an uptrend; it is a repricing, and repricings usually take longer to repair than they took to happen. Updated level maps and the September earnings scenarios sit in the Becoin.net Premium Forecast.
The results were good and the stock fell anyway
The June quarter was strong on the surface. Revenue of $19.18 billion grew 20.6% and beat expectations, earnings per share came in at $2.11 against $1.96 expected, cloud infrastructure revenue rose 93% to $5.8 billion, and remaining performance obligations reached $638 billion, up more than threefold. Shares fell about 7% afterwards regardless.
The reason was capital expenditure. FY26 capex landed at $55.7 billion and FY27 is guided to around $70 billion. The market has decided that the backlog is not the variable that matters; the financing of the backlog is.
The balance sheet is now the story
The numbers behind the derating are specific. Total debt sits near $164 billion, with long-term debt rising from $85.3 billion to $122.3 billion over the fiscal year. Net property, plant and equipment more than doubled from $56.7 billion to $129.6 billion. Free cash flow came in at negative $23.7 billion for FY26 with projections closer to negative $42 billion for FY27, and management has signalled plans to raise roughly $40 billion across debt and equity. One major agency has moved the rating to the lowest investment-grade rung, another holds a negative outlook, and five-year credit default swaps have widened to multi-year highs.
Layered on top is concentration risk: a single large AI customer is reported to account for around half of that record backlog, which means counterparty news transmits directly into Oracle's credit spread. Recent incremental negatives include a reported six-month delay to a gas pipeline serving one of the flagship data-centre projects. Analyst targets remain far above spot — the consensus average sits near $264 — but the dispersion is extreme, from roughly $145 to $325, and dispersion that wide is itself a statement about uncertainty rather than opportunity. Anyone trading a name with this much event risk into a September report should know what their account tier allows first; the limits are listed on the Becoin.net Tariff Plans page.
The level that ends the thesis
The chart resolves on two closes. A daily close above $150.57 that holds puts $159.26 back in play and turns the August low into a credible base, with the 200-day at $175.46 as the level that would end the downtrend outright. A daily close below $130.20 removes the rally leg entirely, leaves the $114.50 low as the only remaining reference, and confirms that the bounce was a bear-market rally rather than a turn. Between those two lines the tape is a fight between a $638 billion order book and the cost of financing it, and until the next report in early September the market has no new information with which to settle it.

Trading Currency Strength Instead of Single Pairs
It was a Tuesday afternoon when I realized I was fighting a losing battle against a ghost. My screen was a chaotic web of indicators. I had the EUR/USD chart open, a moving average crossing over here, a relative strength index flashing oversold there, and a price action setup that looked textbook perfect. I clicked […]

Finding My Perfect Workspace: The Search for the Best Broker for My Daily Trading Routine
The alarm goes off at 6:00 AM. By 6:30 AM, I am sitting in front of my monitors with a steaming mug of black coffee. The house is completely quiet, the market is preparing its next major move, and my charts are completely bare. This is my daily sanctuary. For a long time, this morning […]

Binomo Minimum Deposit vs Minimum Withdrawal: The Real Trap Beginners Miss
I almost fell for the simplest trap on Binomo. Not a bad entry.Not a losing strategy.Not even a bad signal. It was the gap between the Binomo minimum deposit vs minimum withdrawal that quietly changes how beginners behave. When I first opened a real account, the low entry point looked harmless. That’s exactly why it […]

Capital Core 40% Deposit Bonus Explained: Worth It or Risky?
The first time I saw the Capital Core 40% deposit bonus, I reacted exactly the way most traders do. I saw the extra credit, did the quick math in my head, and immediately thought, “That’s more room to trade.” That’s how these offers are designed to feel. They look simple. Deposit money, get 40% more, […]
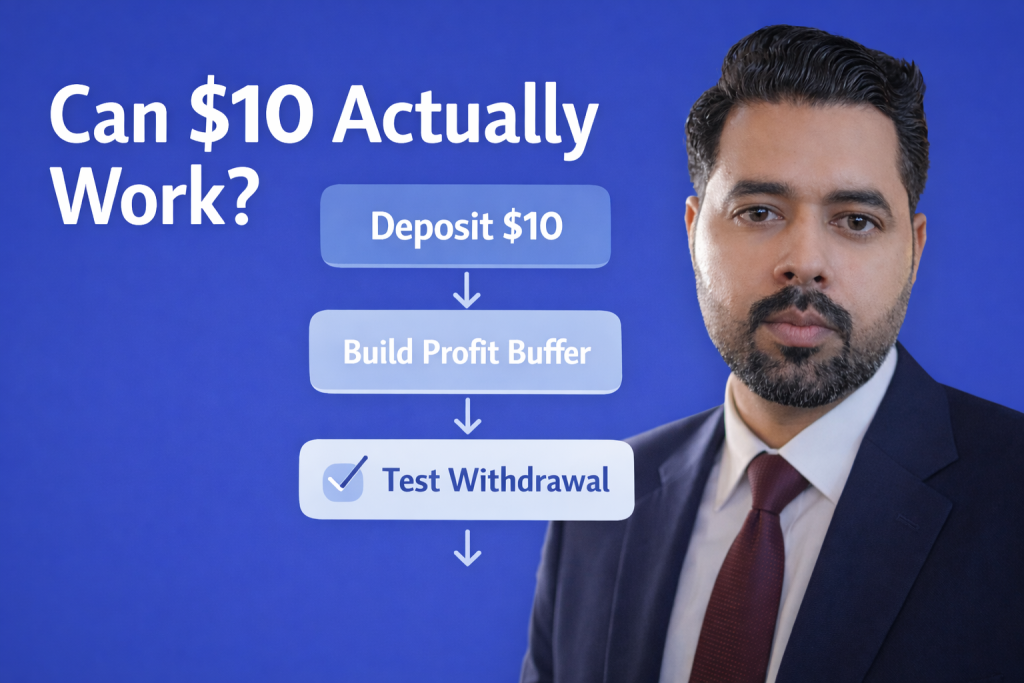
Capital Core Minimum Deposit Strategy: Can You Grow a Small $10 Account?
There’s something dangerously attractive about a broker that lets you start with just $10. It feels harmless. Low risk. Easy to test. Almost too easy. That’s exactly why I wanted to test the Capital Core minimum deposit strategy for myself. Not because I believed a $10 account could become life-changing money. Not because I wanted […]

EUR/USD holds 1.1414 before the ECB decision: three scenarios
EUR/USD traded near 1.1414 before the ECB’s July decision. Here is what a hold, hawkish hold or surprise hike could mean for 1.1350 and 1.1480.