NZDCAD Stalls at the Top of Its Range as Momentum Cools
Where the pair stands
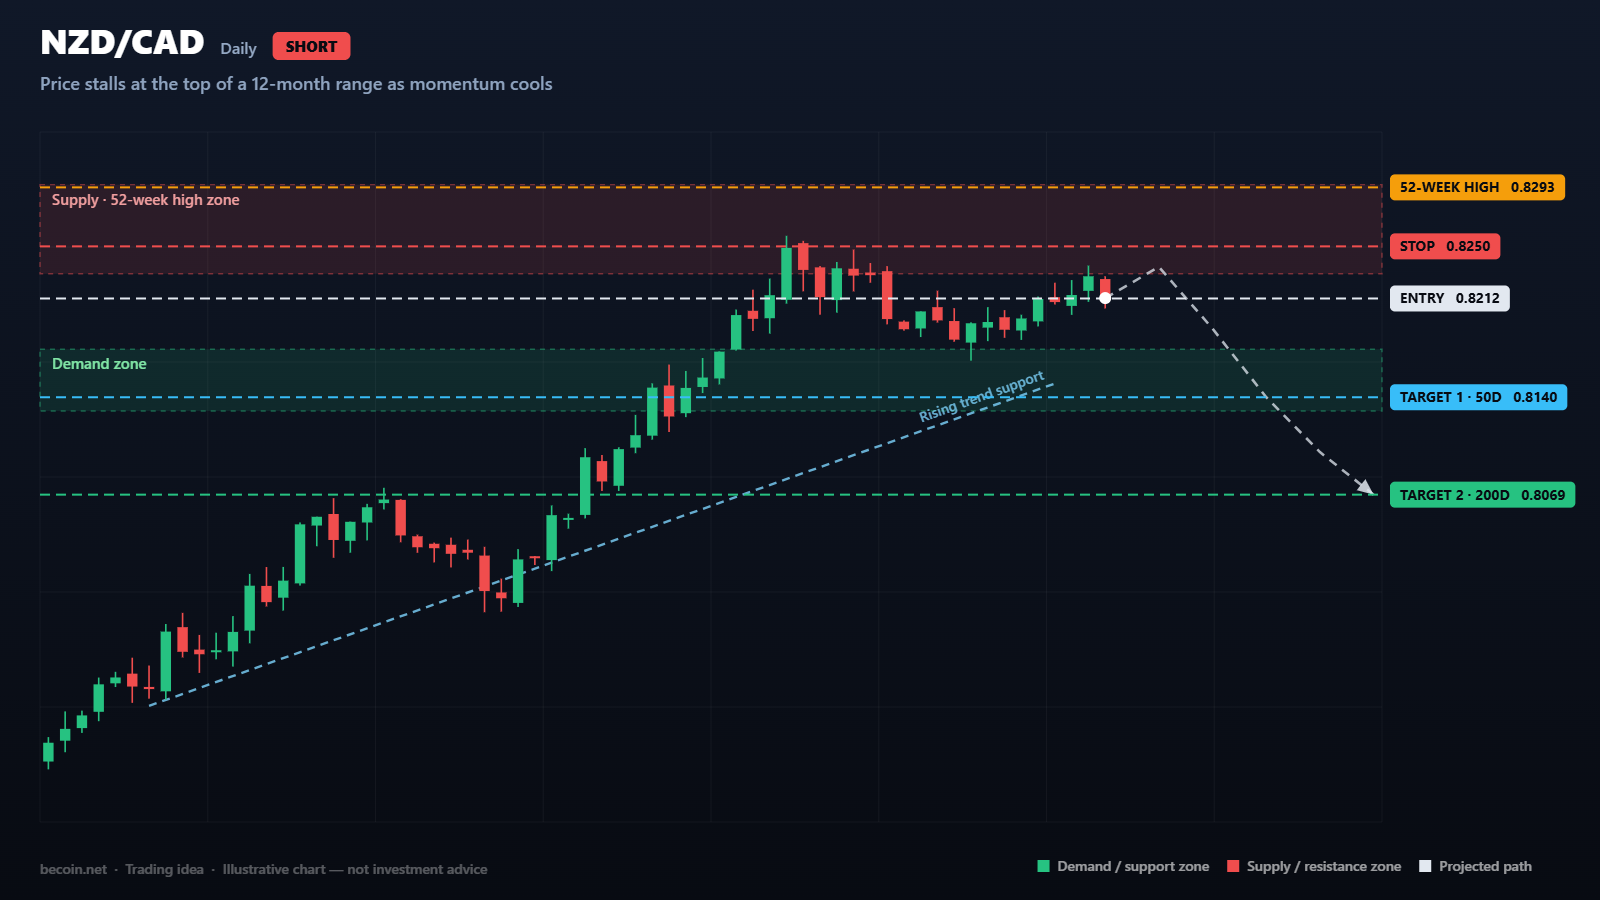
NZD/CAD has spent the past year working its way from the high 0.78s up to the low 0.82s, and it is now trading around 0.8212 with the 52-week high at 0.8293 sitting just overhead. The advance has been genuine rather than accidental, and price remains comfortably above both the 50-day average at 0.8140 and the 200-day at 0.8069. Nothing about the larger trend is broken.
What has changed is the pace. The daily RSI has drifted back to the mid 50s even though price sits within a whisker of the highs, which is the classic footprint of a market that is still rising but no longer accelerating. When a trend needs progressively more effort to make progressively less progress, the reward for chasing it falls sharply.
What the chart is showing
The last several weeks have produced a cluster of upper wicks in the 0.8230 to 0.8290 area. Buyers keep pushing into that band and sellers keep meeting them there. Repeated rejection of that kind turns a price level into a genuine supply zone rather than just a number on a chart, and it tells you where the resting orders are sitting.
Below the market, the rising line drawn across the swing lows since the base formed now runs close to 0.8150, and it happens to line up with the 50-day average. When a trendline and a widely watched moving average converge on the same area, that area tends to matter more than either would on its own.
Levels that matter
Overhead, 0.8230 to 0.8295 is the supply band, and 0.8293 is the specific level a bullish continuation needs to clear on a closing basis. Anything short of a daily close above it is noise.
Below, 0.8140 is the first meaningful shelf and 0.8069 is the deeper one where the 200-day average sits. Between them, the 0.8130 to 0.8175 pocket has already acted as demand once and is the most likely place for buyers to reappear.
How the idea could play out
The setup favours a rotation lower rather than a breakout. Fading strength into the 0.8230 to 0.8250 area with a stop above 0.8295 gives a defined risk of roughly fifty pips against a first objective of 0.8140 and a second at 0.8069. That works out to about twice the risk on the first target and more than three times on the second, which is a workable profile for a counter-trend idea.
It is worth being honest about what this is. The larger structure still points up, so this is a trade against the dominant trend, and trades against the trend deserve smaller size than trades with it.
What would invalidate it
A daily close above 0.8295, particularly one that holds on a retest, changes the picture entirely. At that point the range has resolved higher and the correct response is to stand aside rather than keep fading strength. Traders who cannot accept being wrong quickly on a level like this usually end up paying for the privilege.
Managing the position
Cross rates involving the New Zealand dollar and the Canadian dollar carry two separate sets of risk: commodity prices and risk sentiment on one side, dairy and domestic rate expectations on the other. Both currencies can move on news that has nothing to do with the other, which makes weekend gap risk worth respecting. Reducing size ahead of Canadian employment data or Reserve Bank of New Zealand decisions is a sensible habit here.
Taking partial profit at the 50-day average and trailing the remainder toward 0.8069 keeps the trade honest without demanding a perfect exit.
The bottom line
NZD/CAD is not breaking down, but it is running out of momentum at the top of a well-defined range. That combination usually resolves with a pullback before the next attempt higher, and the risk on this side of the trade can be measured precisely. That is the whole appeal.
Becoin.net Premium Forecast - Becoin.net Tariff Plan
This analysis is a technical study prepared for educational purposes. It is not investment advice, and no outcome described here is guaranteed. Trade only with capital you can afford to lose.

Bitcoin slips to $65,741 as oil and yields test the breakout
Bitcoin is near $65,741 as rising oil and Treasury yields test the $65.7K breakout floor. Here are the levels that confirm or invalidate the move.

EUR/USD holds 1.1414 before the ECB decision: three scenarios
EUR/USD traded near 1.1414 before the ECB’s July decision. Here is what a hold, hawkish hold or surprise hike could mean for 1.1350 and 1.1480.

WTI reaches $89.43 as Brent clears $95 on renewed supply risk
WTI traded near $89.43 while Brent moved above $95 as Middle East shipping risk lifted crude for a fifth session. Key levels, catalysts and invalidation.

The Day I Stopped Trading and Finally Started Making Money
It was a rainy Tuesday morning, and I was staring at my screen with a familiar knot in my stomach. The previous three days had been a slow, agonizing slide into the red. I had given back two weeks of hard-earned profits in less than seventy-two hours. Every asset I clicked on looked like a […]

Which Broker Has Better Risk Management Tools?
The burning smell of my own account blowing up is a scent I will never forget. It was a rainy Tuesday afternoon a few years back. I sat huddled over my laptop, watching a currency pair oscillate. Confident, arrogant, and entirely unprotected, I clicked buy. Minutes later, a sudden market spike completely wiped out my […]

Which Broker Has Faster Withdrawals? Real 2026 Comparison for Traders
When most beginners choose a broker, they focus on bonuses, signals, or flashy interfaces. But after trading for a while, you realize one thing matters more than almost anything else: How fast can you actually withdraw your money? A broker can look perfect until your first withdrawal request gets stuck in “processing” for three days. […]