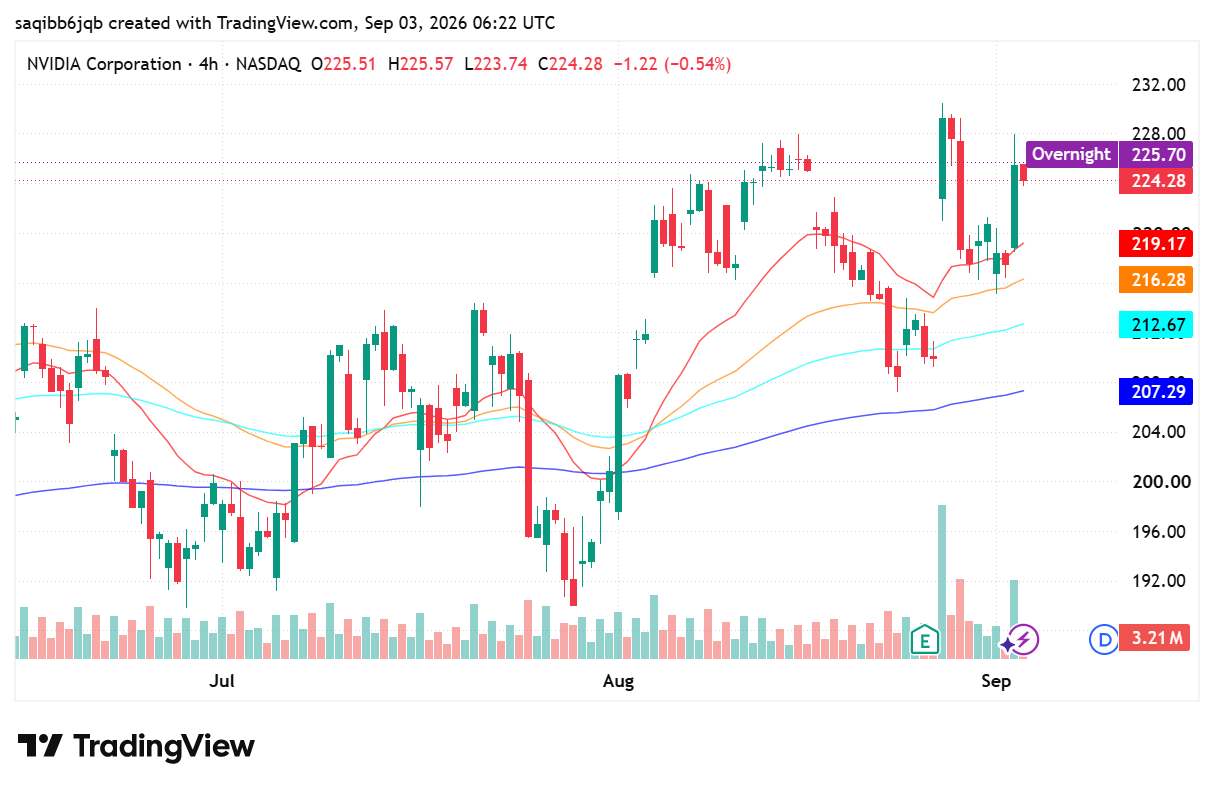
NVDA Forecast: 224.41 Holds Above 219.17 Average
- 224.41 on NVDA, up 3.21% on the day, with price holding above all four 4-hour moving averages.
- Second-quarter revenue of $96.2 billion doubled year on year and third-quarter guidance of $108 billion sits above where consensus had been.
- 219.17 is the first line that matters; the 228 high is what an extension has to clear.
Fundamental Analysis: NVIDIA (NVDA)
The reported numbers left little to argue with. Nvidia posted second-quarter fiscal 2027 revenue of $96.2 billion, up 106% from a year earlier, with data centre revenue of $89.0 billion up 117%. Non-GAAP earnings came in at $2.22 per diluted share against $2.46 on a GAAP basis. Guidance for the current quarter is $108.0 billion plus or minus 2%, which implies the acceleration has not yet plateaued and gave the market a concrete figure to anchor to rather than a qualitative reassurance.
The counterweight is concentration rather than demand. A business where a single segment supplies more than nine tenths of revenue is exposed to the capital expenditure plans of a small number of customers, and those plans are being scrutinised more sceptically than they were a year ago. Meta's own quarter is the clearest example: the market marked the stock down for guiding capital spending toward $145 billion. Nvidia's revenue is the other side of exactly that ledger, so scepticism about hyperscaler returns eventually arrives at this share price.
For now the reported cash flows are winning the argument over the theoretical one. The market is treating the guidance as evidence that orders are booked rather than aspirational, and that is what keeps the stock bid into a period where the broader tape has been choppy. The question the next report has to answer is whether the customer base is broadening or simply spending more.
Technical Analysis: NVIDIA (NVDA)
The structure on the 4-hour chart is a textbook trend stack. The stock based between 190 and 196 through mid-July, dipped to roughly 189 in early August, and has climbed in steps since. The late-August earnings release marked on the chart produced the largest single volume bar on the screen and carried price to 228 on 1 September. The pullback since has been shallow, holding 219 and leaving the four averages rising in order at 219.17, 216.28, 212.67 and 207.29, all of them below spot.
Resistance is the 228 high, with 232 the next reference above it. Support is the 219.17 average, then 216.28, with 212.67 the level that would mark a deeper unwind. A 4-hour close below 216.28 would break the stepped sequence of higher lows that has held since the August bottom and invalidate the trend-following read.

Alphabet falls to $329.71 premarket as AI spending eclipses cloud growth
Alphabet traded near $329.71 premarket after strong Q2 revenue and cloud growth collided with a much larger AI spending plan. What investors need to watch.

Best Broker for Learning Price Action in 2026 (Tested by Real Traders)
Most traders think they need a better strategy. What they actually need is a better understanding of price. A few years ago, one of our community members had over ten indicators on his chart. RSI. MACD. Moving averages. Bollinger Bands. Stochastic. Every new YouTube video added another indicator. The result? More confusion. Not more profits. […]

EUR/USD holds 1.1414 before the ECB decision: three scenarios
EUR/USD traded near 1.1414 before the ECB’s July decision. Here is what a hold, hawkish hold or surprise hike could mean for 1.1350 and 1.1480.

WTI reaches $89.43 as Brent clears $95 on renewed supply risk
WTI traded near $89.43 while Brent moved above $95 as Middle East shipping risk lifted crude for a fifth session. Key levels, catalysts and invalidation.

Trading Currency Strength Instead of Single Pairs
It was a Tuesday afternoon when I realized I was fighting a losing battle against a ghost. My screen was a chaotic web of indicators. I had the EUR/USD chart open, a moving average crossing over here, a relative strength index flashing oversold there, and a price action setup that looked textbook perfect. I clicked […]

The Day I Stopped Trading and Finally Started Making Money
It was a rainy Tuesday morning, and I was staring at my screen with a familiar knot in my stomach. The previous three days had been a slow, agonizing slide into the red. I had given back two weeks of hard-earned profits in less than seventy-two hours. Every asset I clicked on looked like a […]