Netflix Keeps Failing Under Its 50 Day Line
Where the stock stands
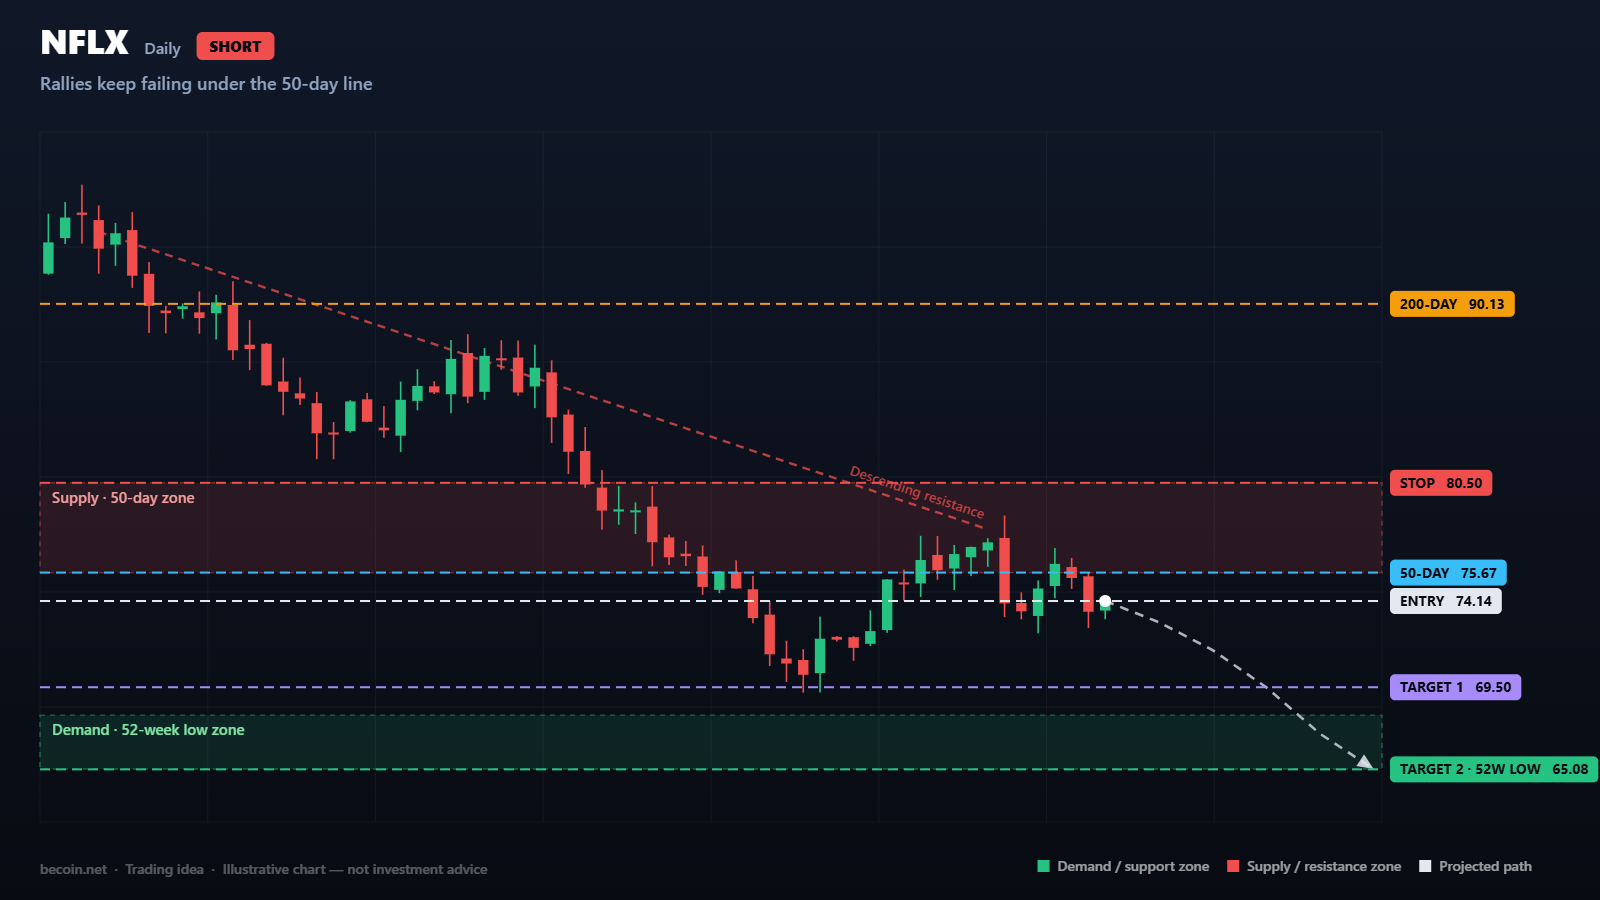
Netflix is trading near 74.14 after a steady decline from the 126.71 high. The stock sits below its 50-day average at 75.67 and a long way below the 200-day at 90.13, and both averages are sloping down. That alignment, with the shorter average beneath the longer one and price beneath both, is the textbook definition of a downtrend, and it is worth stating plainly before looking for reasons to be optimistic.
The daily RSI near 52 is the one detail that complicates the picture. Momentum has recovered from oversold without the price making meaningful progress, which usually means a bounce has run out of fuel rather than that a bottom has formed.
What the chart is showing
The decline has respected a falling line drawn across the highs since the top. Every rally has died at or just below that line, and the current one has stalled again in the 74 to 76 area, right where the 50-day average happens to sit. Two separate forms of resistance arriving at the same price is what makes this level worth trading against rather than ignoring.
Below the market, the 65 to 68 zone is the last shelf before the 52-week low at 65.08. Price has not tested it recently, which means there is relatively little structure between the current price and that area to slow a decline down.
Levels that matter
Resistance is 75.67 at the 50-day, then 80.50 where the last failed rally peaked. Above that, 90.13 at the 200-day is the level that would genuinely change the trend.
Support sits at 69.50 first, then 65.08 at the 52-week low. A break below 65.08 would put the stock in fresh 12-month lows with no obvious technical reference underneath.
How the idea could play out
The bearish case is straightforward continuation. Selling into strength around 74 to 76 with a stop above 80.50 gives roughly six and a half dollars of risk against a first target at 69.50 and a second at 65.08. That works out to about 0.7 times risk on the first target and 1.4 times on the second, which is thin. Waiting for a rally closer to 78 improves the ratio considerably and is probably the better use of patience.
This matters more than it might appear. A trade with a good thesis and a poor entry price is still a poor trade, and downtrends usually provide better prices to short than the ones available right after a bounce has already faded.
What would invalidate it
A daily close above 80.50 breaks the falling resistance line and would suggest the decline has found a floor. A close above the 200-day at 90.13 would end the bearish argument entirely. Either outcome is a signal to stand aside rather than to add.
Managing the position
The obvious risk with any short in a large, widely held name is that earnings and subscriber announcements can move the price by double digits overnight. Holding a short through a scheduled report is a decision to accept an outcome that no chart can predict, and reducing or closing ahead of those dates is the more disciplined choice.
Covering half at 69.50 and trailing the balance toward the 52-week low keeps the trade manageable without requiring a perfect exit.
The bottom line
Netflix is in a downtrend, rallies keep failing at the same place, and the levels below are clear. The thesis is sound. The current price simply does not offer much reward for the risk, which makes this a setup to prepare for rather than one to execute immediately.
Becoin.net Premium Forecast - Becoin.net Tariff Plan
This analysis is a technical study prepared for educational purposes. It is not investment advice, and no outcome described here is guaranteed. Trade only with capital you can afford to lose.

WTI reaches $89.43 as Brent clears $95 on renewed supply risk
WTI traded near $89.43 while Brent moved above $95 as Middle East shipping risk lifted crude for a fifth session. Key levels, catalysts and invalidation.

Bitcoin slips to $65,741 as oil and yields test the breakout
Bitcoin is near $65,741 as rising oil and Treasury yields test the $65.7K breakout floor. Here are the levels that confirm or invalidate the move.

Trading Currency Strength Instead of Single Pairs
It was a Tuesday afternoon when I realized I was fighting a losing battle against a ghost. My screen was a chaotic web of indicators. I had the EUR/USD chart open, a moving average crossing over here, a relative strength index flashing oversold there, and a price action setup that looked textbook perfect. I clicked […]

How Liquidity Affects Day Trading Results
When I first started trading day trading, I believed success was all about finding the perfect indicator. I spent weeks testing moving averages, RSI settings, support and resistance levels, and dozens of YouTube strategies that promised easy wins. Some worked for a few trades, but most failed. What confused me was that the same setup […]

The Day I Lost My First Ten Dollars: My Hunt for the Best Mobile Trading App for Beginners
I still remember the exact shape of the cloud outside my window when my first live trade ended in the red. It was a crisp morning, and I was sitting on my couch with a lukewarm cup of coffee, staring at a flashing line on my smartphone screen. I had just deposited ten bucks, convinced […]

Deriv vs IQ Option for Beginners in 2026: Which Platform Is Better to Start With?
Choosing your first trading platform can decide whether you stay consistent or quit after blowing your first account. Most beginners do not fail because trading is impossible. They fail because they start on platforms that confuse them, encourage emotional trading, or make risk management difficult. Two names that often appear in beginner discussions are Deriv […]