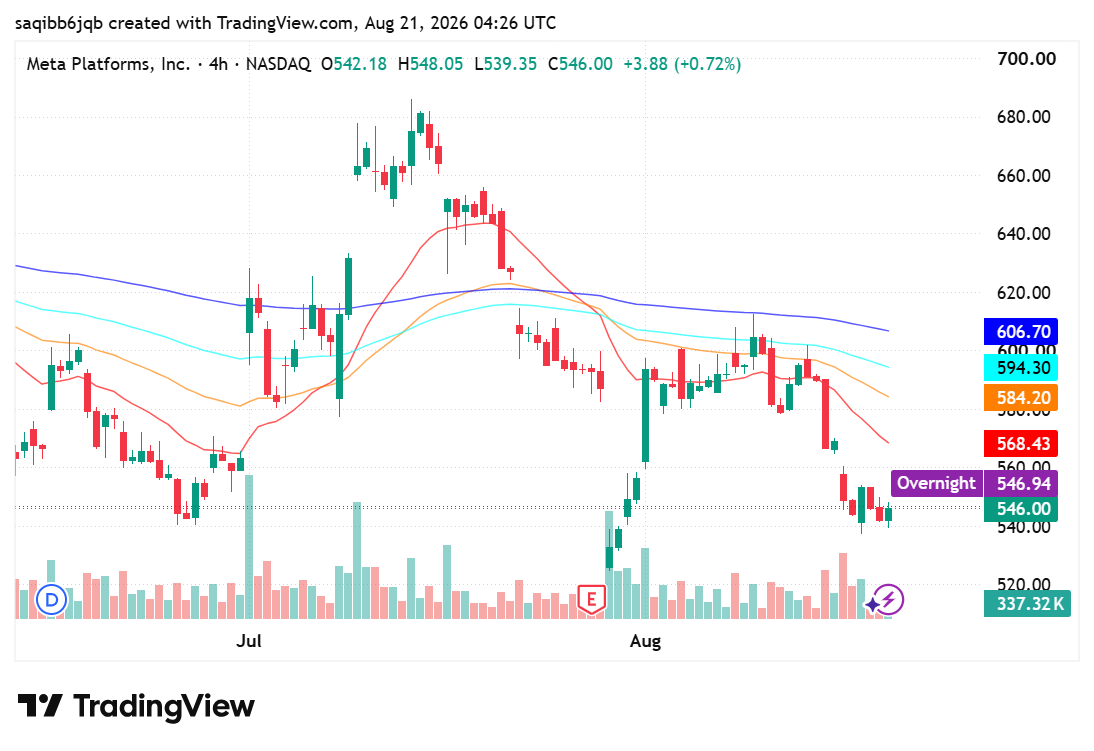
META Stock Forecast: 545.83 Capped by the 568 Average
- Meta Platforms trades at 545.83, essentially flat on the day at minus 0.04% after a 539.35 to 548.05 session range.
- Second-quarter revenue rose 28% to $60.8 billion, but full-year capital spending guidance of $130 to $145 billion cut earnings per share by 13%.
- The 568.43 moving average is the level that decides the next move; it has capped every rally attempt since the earnings gap.
Fundamental Analysis: META
The operating business is not the problem. Meta reported second-quarter revenue of $60.801 billion, up 28% year on year, with family daily active people averaging 3.60 billion in June, a 3% increase. Third-quarter guidance of $61 to $64 billion implies the advertising engine is still compounding. On the top line this was a strong quarter by any reasonable measure.
The counterweight is what that growth now costs. Diluted earnings per share fell 13% to $6.18 and net income dropped 14% to $15.848 billion, weighed by $2.4 billion of legal charges and $1.18 billion in severance. More consequentially, the company guided full-year capital expenditure including finance lease principal to $130 to $145 billion and total expenses to $165 to $169 billion. Investors are being asked to fund an infrastructure build whose returns arrive on a horizon nobody has committed to.
The balance is a stock caught between a business that works and a spending plan that has not yet been underwritten by the market. That is why the shares gave back the post-earnings rebound rather than extending it: each rally runs into the same unanswered question about the payback period. Until a quarter arrives that ties the spending to incremental revenue, the burden of proof sits with the company, and price is behaving accordingly.
Technical Analysis: META
The damage was done in one move. Price peaked near 684 in late July, gapped sharply lower on the second-quarter release and bottomed near 505 in early August. The rebound that followed reached roughly 600 before failing, and the shares have since slid back into the 539 to 548 area. All four moving averages now sit overhead at 568.43, 584.20, 594.30 and 606.70, in bearish sequence, which is the clearest structural read on the chart.
Resistance is the 568.43 fast average, then 584.20, with 594.30 marking where the failed rebound stalled. Support is the 539.35 session low, then the early-August floor near 505. A four-hour close back above 584.20 would be the first genuine sign the post-earnings downtrend has ended.

Alphabet falls to $329.71 premarket as AI spending eclipses cloud growth
Alphabet traded near $329.71 premarket after strong Q2 revenue and cloud growth collided with a much larger AI spending plan. What investors need to watch.

How Liquidity Affects Day Trading Results
When I first started trading day trading, I believed success was all about finding the perfect indicator. I spent weeks testing moving averages, RSI settings, support and resistance levels, and dozens of YouTube strategies that promised easy wins. Some worked for a few trades, but most failed. What confused me was that the same setup […]

Best Broker for One Trade a Day Strategy in 2026
Most traders lose money because they trade too much. They enter random setups, chase candles, overreact emotionally, and turn a simple strategy into pure gambling. That is exactly why the one trade a day strategy is becoming more popular among smart traders in 2026. Instead of sitting in front of charts all day, this approach […]

Trading Currency Strength Instead of Single Pairs
It was a Tuesday afternoon when I realized I was fighting a losing battle against a ghost. My screen was a chaotic web of indicators. I had the EUR/USD chart open, a moving average crossing over here, a relative strength index flashing oversold there, and a price action setup that looked textbook perfect. I clicked […]

The Clock and the Cash: My Journey into the Hidden Rhythm of Session-Based Trading
There was a time when I thought the global financial market was a single, monstrous wave that never stopped moving. I believed that if I sat in front of my monitors long enough, clicking buttons whenever a pretty pattern appeared on my charts, the market would eventually reward my sheer endurance. I was dead wrong. […]

Best Broker for Learning Price Action in 2026 (Tested by Real Traders)
Most traders think they need a better strategy. What they actually need is a better understanding of price. A few years ago, one of our community members had over ten indicators on his chart. RSI. MACD. Moving averages. Bollinger Bands. Stochastic. Every new YouTube video added another indicator. The result? More confusion. Not more profits. […]