Mastered Trend Strength with the ADX Indicator
Early in my trading journey, I spent months trapped in an exhausting cycle. I would spot a beautiful breakout, rush to open a position, and watch in frustration as price immediately reversed, triggering my stop loss. I assumed my chart patterns were wrong or my timing was off. In reality, I was making a fundamental mistake that plagues thousands of retail traders: I was entering markets that had direction, but zero strength.
Everything changed when I stopped relying solely on price direction and started measuring market velocity. That was the moment I discovered the Average Directional Index, commonly known as the ADX indicator. Developed by J. Welles Wilder in 1978, this single tool completely shifted my perspective on market dynamics. It taught me when to ride a powerful trend, when to stay on the sidelines, and most importantly, how to avoid getting chopped up in range-bound markets.
Here is my personal playbook on how the ADX works, how I use it to measure trend strength, and how you can integrate it into your daily trading workflow.
Understanding ADX: The Speedometer of Technical Analysis
When I first loaded the ADX onto my charts, I was confused. I noticed the indicator moving upward while the price of Bitcoin was aggressively dumping. I initially thought the indicator was broken.
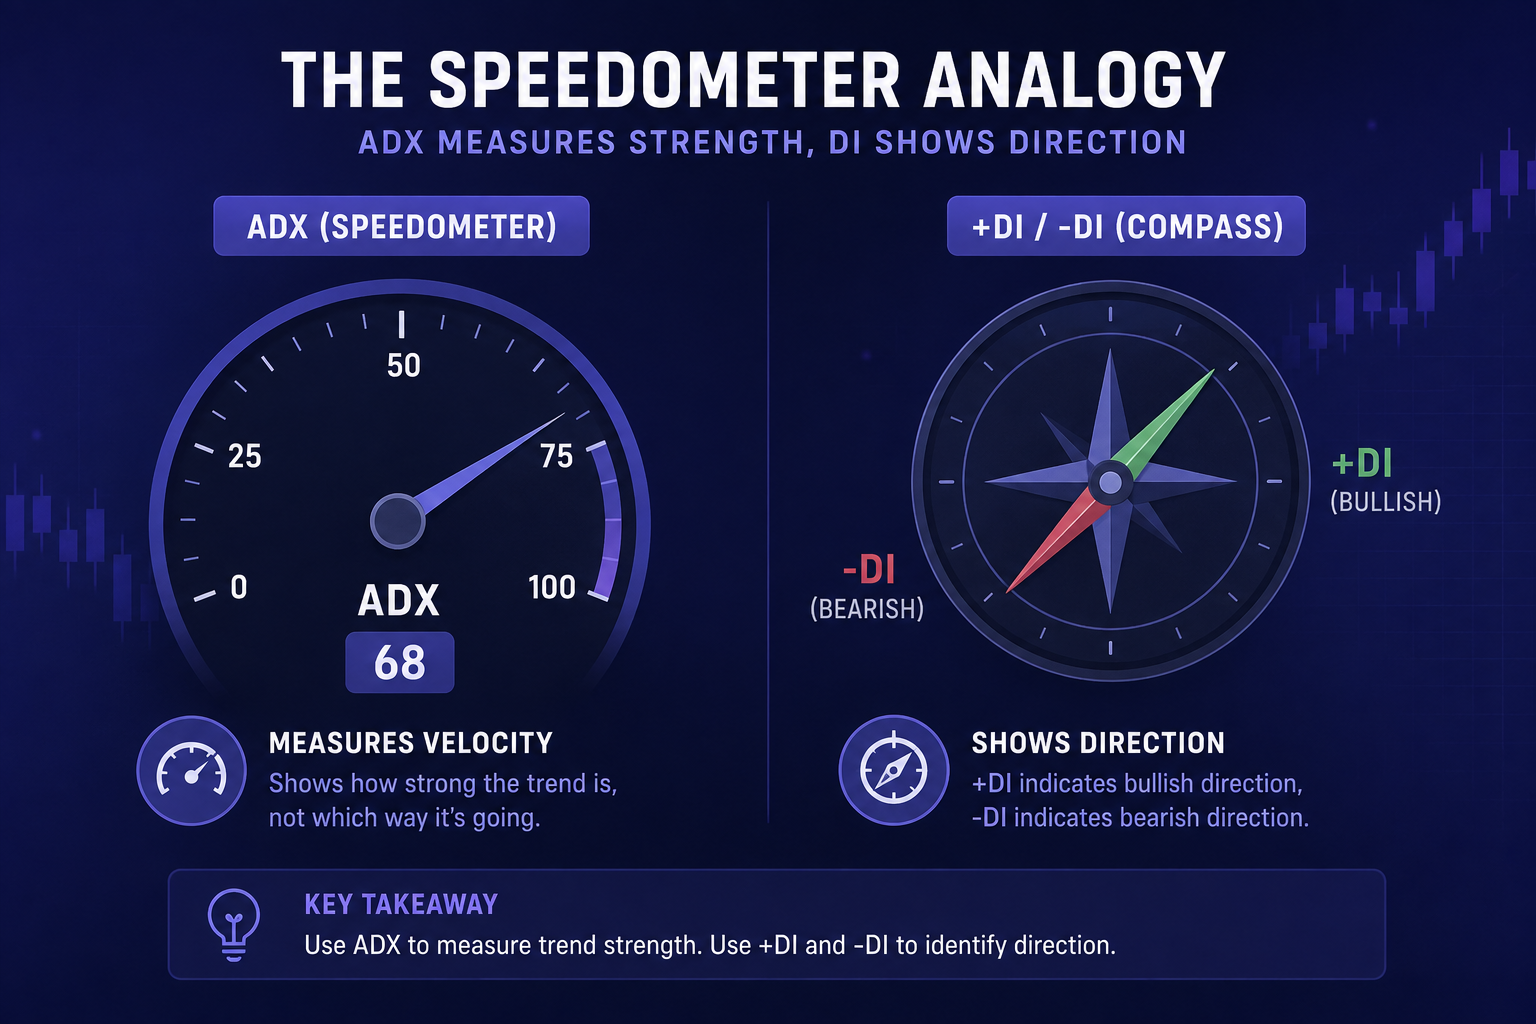
That was my first big epiphany: ADX does not tell you which direction the market is moving; it only tells you how strongly it is moving.
Think of ADX as the speedometer in your car. Whether you are driving forward down a highway or backing out of your driveway, your speedometer records your speed. If you are going 90 miles per hour down a hill, your speedometer reads 90. If you hit a wall and come to a halt, it drops to zero.
ADX operates on a scale from 0 to 100:
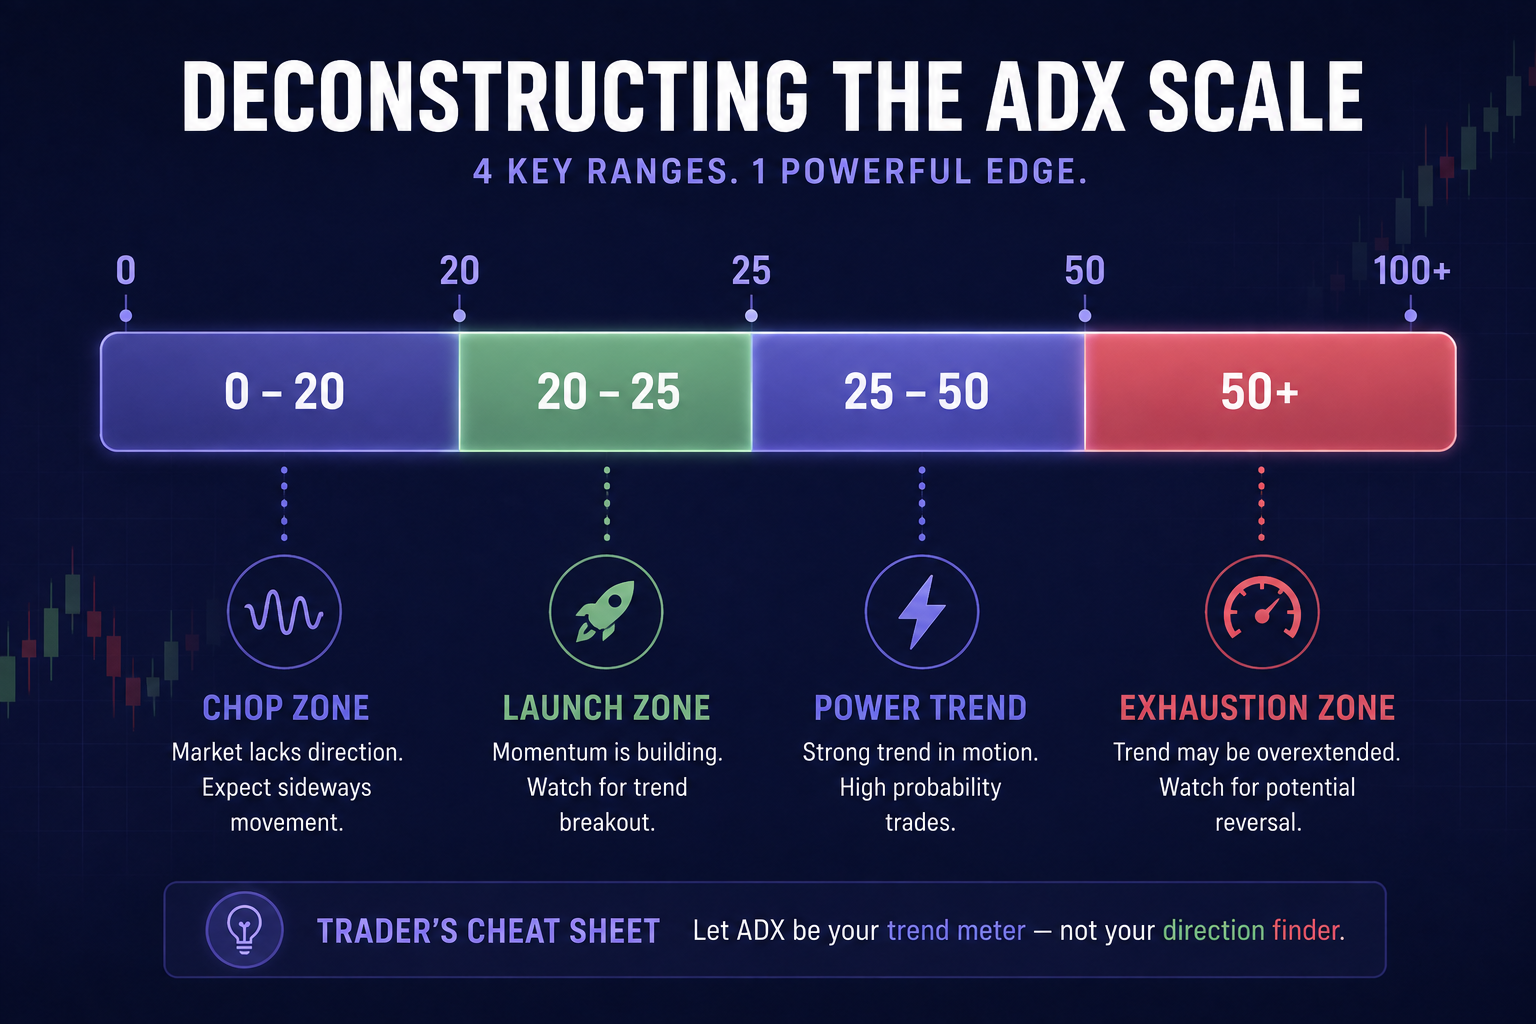
- 0 to 20: The market is sleeping or moving sideways. Trend strength is non-existent.
- 20 to 25: A potential trend is forming or transitioning out of a consolidation pattern.
- 25 to 50: Strong trend territory. This is where trend-following strategies generate maximum returns.
- 50 to 100: Extremely strong or parabolic trend. Be cautious, as markets rarely sustain values above 50 without a significant pullback.
To determine direction, ADX relies on two companion lines that travel alongside it: the Positive Directional Indicator (+DI) and the Negative Directional Indicator (-DI). When +DI is above -DI, buyers are dominating price action. When -DI is above +DI, sellers are in control. The main ADX line simply quantifies the power behind whichever group is winning the tug-of-war.
If you want to observe these lines reacting to live price action without risking real capital, I recommend setting up a demo account on platforms like IQ Option or practicing charting on Quotex. Seeing how +DI and -DI cross over during real-time volatility makes the theory sink in far faster than studying static charts.
Deconstructing the ADX Scale: Reading the Market's Engine
Learning to read the ADX line correctly saved me thousands of dollars in bad entries. In my early days, I used to take every single moving average crossover signal I saw. In a ranging market, that is a guaranteed recipe for account death by a thousand paper cuts.
By adding an ADX filter set to a standard 14-period lookback, I learned to segment the market into distinct operational zones.
The Chop Zone (ADX Below 20)
When ADX sits below 20, the market is in a low-volatility consolidation or range. Price fluctuates randomly within support and resistance levels. Attempting to trade breakout strategies when ADX is under 20 is dangerous because breakouts lack the volume and institutional backing to sustain momentum. During these phases, I either switch to range-bound strategies or stand aside completely.
The Launch Zone (ADX Crossing Above 20-25)
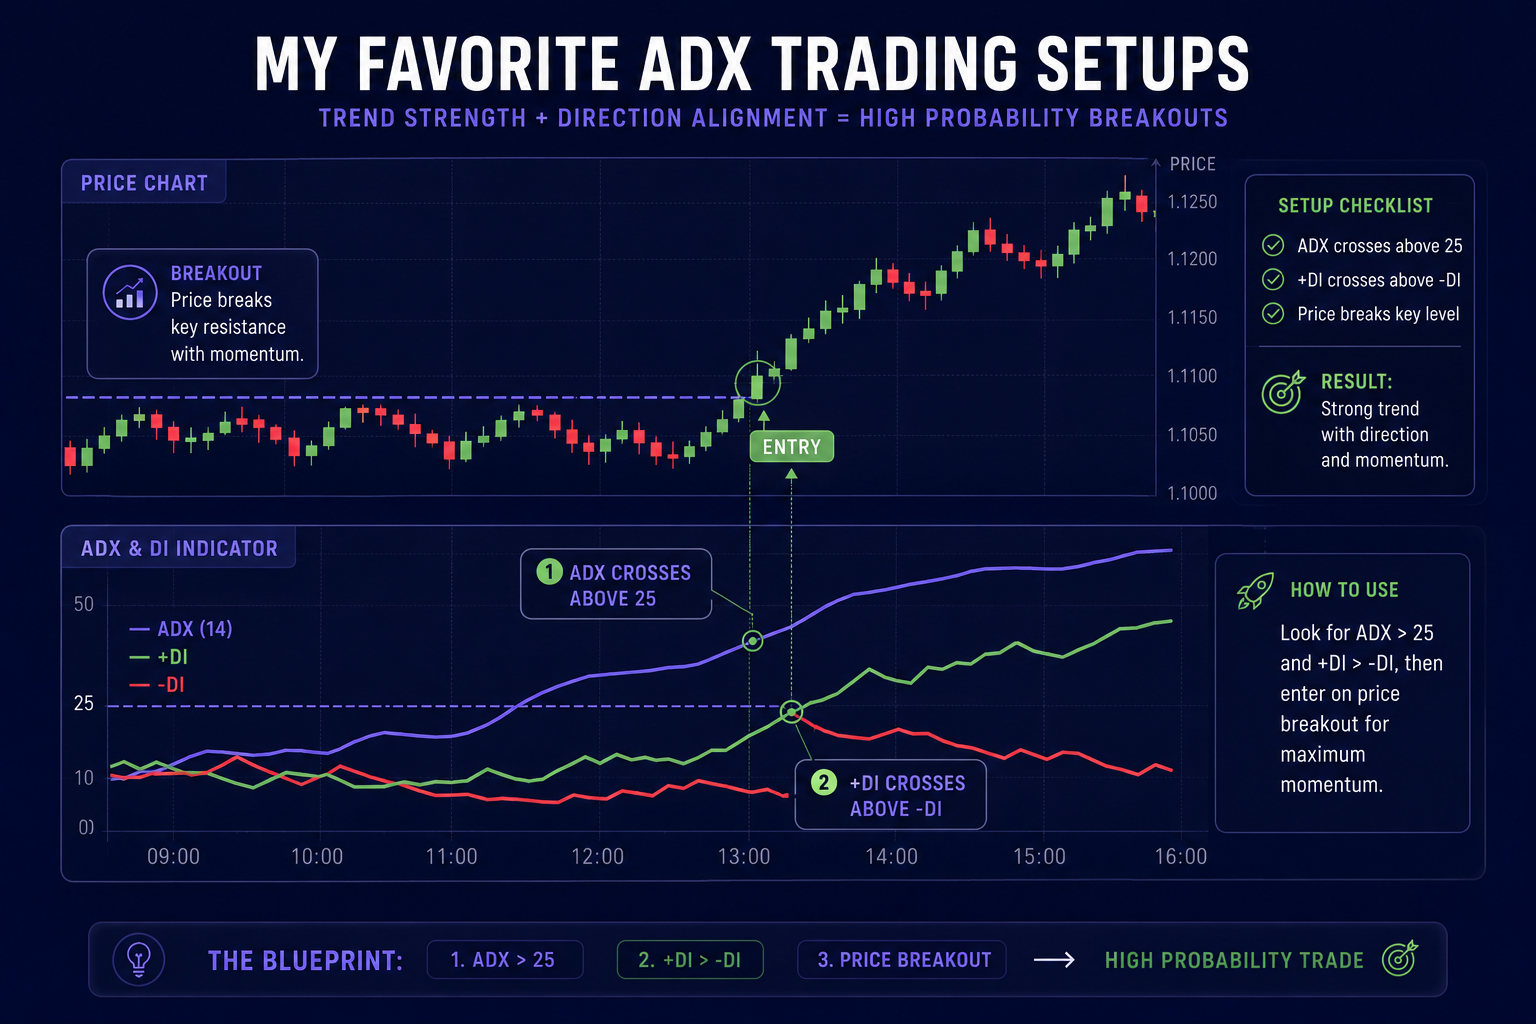
This is the threshold where momentum begins to build. When I see the ADX line slope upward and cross above 25 from below, my alarm bells ring. It signals that price is breaking out of a squeeze and institutional volume is entering the market. If +DI is comfortably above -DI during this cross, I prepare for a long entry.
The Power Zone (ADX Between 25 and 50)
This is the golden zone for trend followers. When ADX travels between 25 and 50, price movements are sustained and orderly. Pullbacks to key moving averages during this phase offer prime lower-risk entry points. As long as the ADX line remains sloped upward within this range, I hold my positions and let my profits run.
The Exhaustion Zone (ADX Above 50)
A common beginner mistake is assuming an ADX reading of 60 or 70 means a buy signal is ultra-strong. In my experience, when ADX surges well above 50, the market is usually in a climax phase (FOMO buying or panic selling). These moves are unsustainable. Rather than opening new positions here, I look to lock in partial profits or tighten my stop losses.
My Favorite ADX Trading Setups
Over years of testing setups across multi-asset trading brokers like Deriv and high-frequency environments like Pocket Option, I have streamlined my approach to three high-probability ADX setups.
Setup 1: The Trend Confirmation Filter
Instead of using ADX in isolation, I pair it with a 50-period Exponential Moving Average (EMA).
- Buy Condition: Price must be trading cleanly above the 50 EMA, +DI must be above -DI, and the ADX line must be above 25 and sloping upward.
- Sell Condition: Price must be below the 50 EMA, -DI must be above +DI, and the ADX line must be above 25 and sloping upward.
This setup prevents me from shorting a market that is merely pulling back in a strong bull run, or buying an asset that is sinking into a deep downtrend.
Setup 2: The Squeeze Breakout Entry
When ADX remains below 20 for an extended period, energy builds up like a compressed spring. I wait patiently for a chart pattern (such as a triangle or rectangle consolidation) to form.
When price breaks out of the pattern, I look at the ADX line. If the breakout candle causes ADX to curl upward sharply and cross 20, I take the trade in the direction of the directional indicator (+DI or -DI) that leads the move. To refine your ability to spot structural chart patterns before these breakouts happen, explore the technical breakdowns published regularly on the Becoin Blog.
Setup 3: Spotting Bearish ADX Divergence
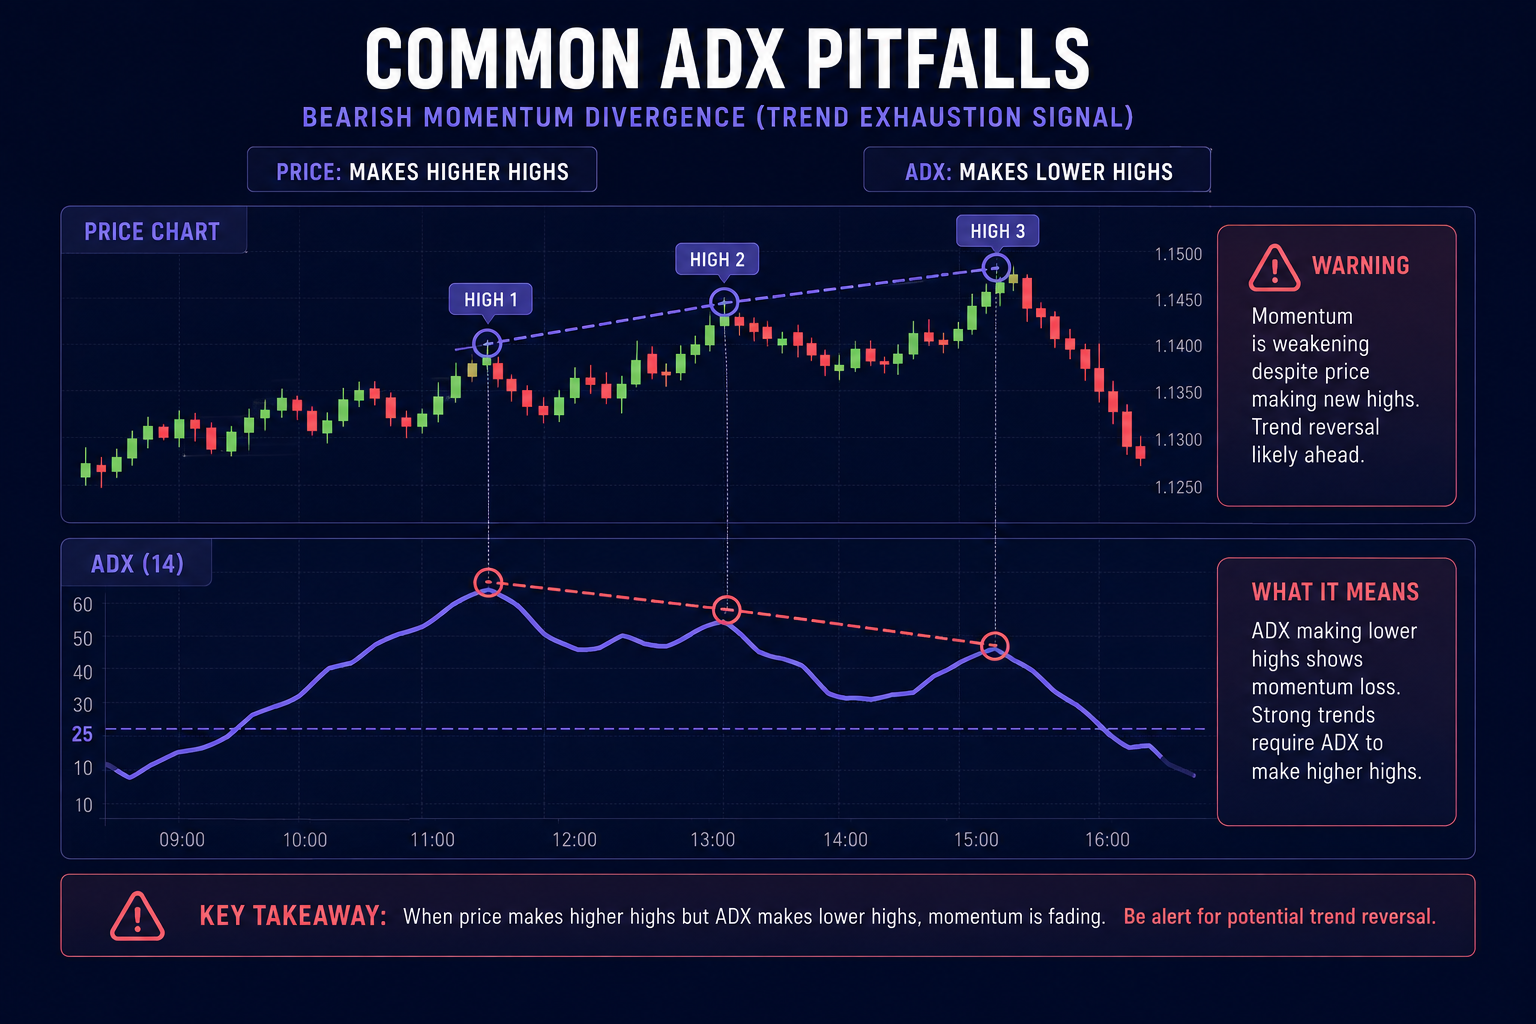
One of my most profitable uses of ADX is identifying trend exhaustion before the rest of the retail market notices.
If price makes a fresh higher high, but the ADX indicator makes a lower high compared to its previous peak, momentum is fading. Buyers are pushing prices higher on dwindling volume and enthusiasm. When I spot this negative divergence, I stop adding to long positions and prepare for an impending reversal or deep pullback.
Whether you trade traditional forex markets via Olymp Trade and Expert Option, or speculate on crypto derivatives through Capital Core, combining momentum divergence with key support and resistance zones dramatically raises your win rate.
Three Costly ADX Mistakes You Must Avoid
- Confusing ADX Direction with Price Direction: I cannot stress this enough. A falling ADX line does not mean price is falling; it simply means the current trend is losing momentum and entering a consolidation phase.
- Taking Signals in a Flat Line Environment: If the ADX line is moving sideways flat below 20, ignore crossover signals between +DI and -DI. In a sideways market, those directional lines will cross back and forth repeatedly, wiping out your account with false signals.
- Ignoring Higher Timeframe Context: A 5-minute ADX setup can look wildly bullish while slamming directly into a major daily resistance level. Always perform multi-timeframe analysis to ensure your short-term trend aligns with the larger market structure.
To keep track of broader macro trends and institutional market setups across global assets, I regularly consult the multi-asset sentiment metrics available on the Becoin Forecast Hub. Aligning your local indicator signals with macro market flow is how you transition from an amateur trader to a disciplined professional.
Gain a Real Edge in Today's Markets
Mastering the ADX indicator transformed my trading from erratic guessing into a structured, probability-based system. It taught me the discipline to sit on my hands when the market is lifeless and the confidence to strike aggressively when genuine trend momentum arrives.
Indicators are powerful filters, but they are only one piece of the puzzle. To navigate volatile crypto and financial markets consistently, you need real-time data, institutional sentiment context, and actionable technical analysis delivered before moves happen.
If you are ready to stop trading blind and want access to premium market breakdowns, live trade setups, and institutional-grade analytics, it is time to upgrade your toolkit. Join Becoin Premium today and get the professional edge you need to stay ahead of the curve.

Deriv vs IQ Option for Synthetic Indices: Which Platform Is Better in 2026?
Synthetic indices have become one of the most talked about trading categories among beginners and experienced traders alike. Unlike forex or crypto markets that depend on real world events, synthetic indices operate 24/7 using algorithm driven price movements. That means traders can access opportunities at any time without waiting for market openings or major news […]

Binomo First $10–$50 Test Deposit Plan: The Safest Way to Validate the Platform Before Scaling
I didn’t start with confidence. I started with doubt. Every time I searched for answers about Binomo, I found opinions, not proof. Some people claimed fast withdrawals. Others complained about delays. But almost nobody showed a complete journey from deposit to withdrawal using real money. So I stopped reading and started testing. Instead of risking […]

How I Learned to Sit on My Hands During Choppy Markets
I remember the morning vividly. It was a Tuesday. The coffee on my desk was still piping hot, the charts on my screen were blinking, and I was feeling incredibly confident. I had just finished reading about how market open hours create the best trading opportunities, and I was ready to hunt for a clean […]

Best Broker for Learning Price Action in 2026 (Tested by Real Traders)
Most traders think they need a better strategy. What they actually need is a better understanding of price. A few years ago, one of our community members had over ten indicators on his chart. RSI. MACD. Moving averages. Bollinger Bands. Stochastic. Every new YouTube video added another indicator. The result? More confusion. Not more profits. […]

Why Traders Move from Binomo to Deriv in 2026: The Real Reasons Behind the Switch
If you spend enough time around trading communities, you’ll notice a pattern. Many traders start with Binomo. Then, after a few months, a surprising number begin looking at Deriv. Some switch completely. Others keep both accounts but gradually move most of their trading activity to Deriv. I noticed this trend while talking to beginner traders […]

Can You Start Trading with $10 on Deriv?
A lot of beginners enter trading with the same question: “Is $10 actually enough to start trading on Deriv?” The short answer is yes. But the real answer is more complicated. You can start with $10 on Deriv, but whether you can survive, learn, and grow that account depends entirely on your expectations, discipline, and […]