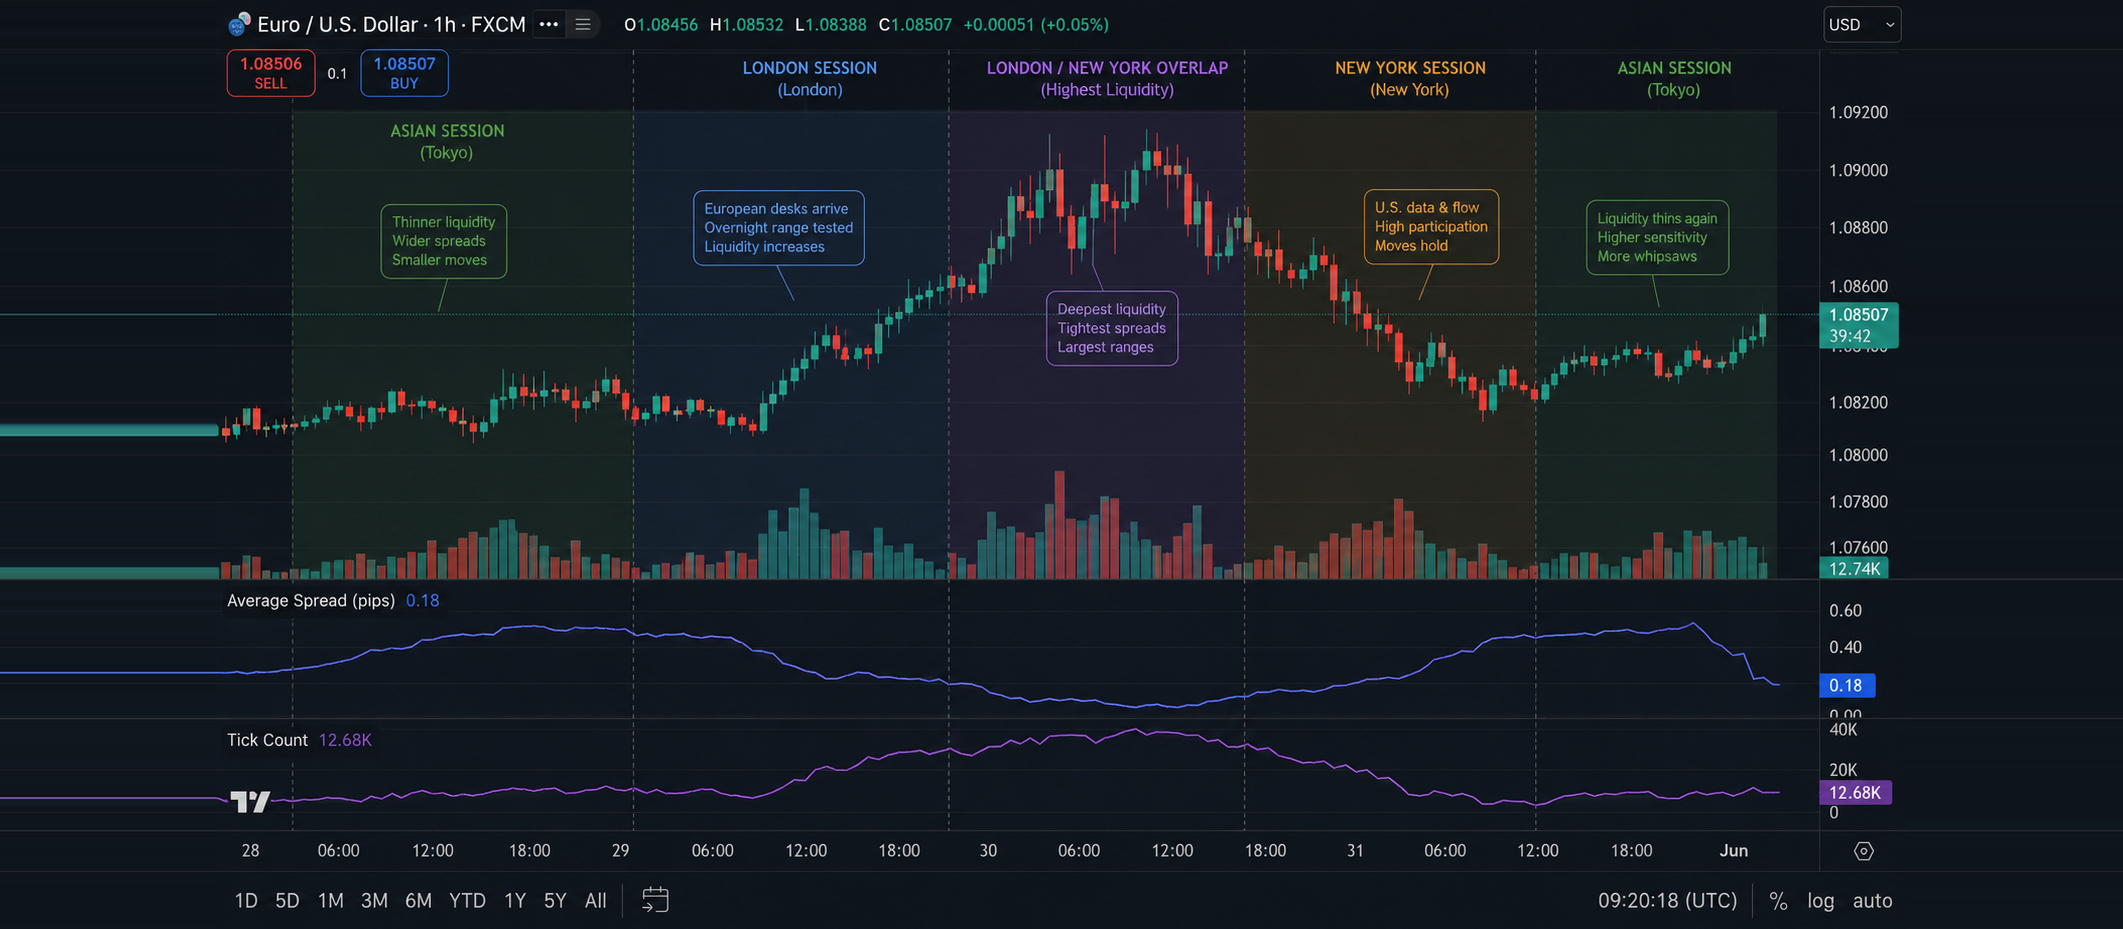
Liquidity Windows in Currency Markets: Why Session Overlaps Change How Price Behaves
Most discussion of currency markets treats the trading day as one continuous environment. It is not. The same pair can absorb a large order without flinching at one hour and gap through several pips on a modest ticket a few hours later. That difference is not about sentiment or analysis quality, it is about who is at the desk. Understanding when depth arrives and when it leaves is one of the more practical pieces of market-structure knowledge available, and it rarely gets covered outside institutional research.
What liquidity windows are and how they form
Liquidity windows are the recurring periods when the largest share of price-making capital is active. Foreign exchange is decentralized, so there is no single order book to inspect, but participation still follows the clock. Asian hours are dominated by regional banks, exporters and Australasian flow. European hours bring in the largest concentration of interbank dealing, with London handling the biggest slice of global turnover. The American session adds domestic institutional flow, futures activity and reaction to United States data. Each handover changes who is quoting and how much risk they are willing to hold.
The handover between Tokyo, London and New York
The transitions matter as much as the sessions themselves. The late Asian to early European handover often produces the first genuine test of overnight ranges, because European desks arrive with fresh risk limits and a view formed after the Asian close. The European to American handover is different again, since it typically coincides with scheduled data releases and the largest simultaneous presence of participants across time zones. The final hours of the American session are the thinnest of the working week, which is when small orders can produce disproportionate moves.
Why the London to New York overlap behaves differently
For roughly four hours, the two deepest pools of currency liquidity are open together. Depth is at its maximum, spreads at their tightest and the market's ability to absorb size at its highest. Counter-intuitively, this is also when the largest ranges are usually set, because that depth is what allows genuinely large positions to be established and unwound. Moves that begin inside this overlap and hold through the American afternoon tend to reflect real repositioning. Moves that begin after the overlap closes carry a much higher chance of being liquidity artefacts.
What thin conditions do to price behaviour
When depth falls away, three things change. Spreads widen, so the cost of participation rises. The size required to move price falls, so identical order flow produces larger displacements. And the market's memory shortens, because there are fewer resting orders to defend previous levels. This is why sharp moves in illiquid hours are often retraced when depth returns, and why a level that looked decisive overnight can be ignored entirely once London arrives.
The data that describes depth
Several observable inputs help map conditions rather than guess at them. Futures volume by hour shows where participation clusters. Tick counts and average spread by session reveal how quoting behaviour shifts. Options expiry times and fixing windows create predictable pockets of concentrated activity. Cross-checking these against the calendar of central bank speakers and data releases gives a fuller picture, and the Market Forecast Hub is a convenient place to see how those inputs line up across pairs.
What would change this map
Session structure is stable but not permanent. Holiday calendars remove entire pools of liquidity for a day at a time. Electronic market making has already flattened some of the historical differences between sessions, and further automation could continue that trend. Major structural changes, such as a shift in settlement conventions or a large participant withdrawing from market making, would require redrawing the map. If spreads and depth stop varying meaningfully by session, the framework loses its usefulness, and that is exactly the condition to monitor.
Using session structure as context
None of this suggests when to buy or sell anything. It is context for interpreting what you see: whether a move happened in conditions capable of supporting it, and whether the level being tested was set by real participation or by an empty book. That distinction changes the meaning of the same chart, which is why it belongs in analysis rather than in a signal.

Trading Currency Strength Instead of Single Pairs
It was a Tuesday afternoon when I realized I was fighting a losing battle against a ghost. My screen was a chaotic web of indicators. I had the EUR/USD chart open, a moving average crossing over here, a relative strength index flashing oversold there, and a price action setup that looked textbook perfect. I clicked […]

How Liquidity Affects Day Trading Results
When I first started trading day trading, I believed success was all about finding the perfect indicator. I spent weeks testing moving averages, RSI settings, support and resistance levels, and dozens of YouTube strategies that promised easy wins. Some worked for a few trades, but most failed. What confused me was that the same setup […]

How Understanding Market Structure Saved My Day Trading
I remember the exact moment my trading account hit zero for the third time in a single month. It was a rainy Tuesday evening, and I was staring at a 1-minute chart on my laptop screen. The price had been moving up aggressively. It looked like a flawless rocket ship to the moon. I clicked […]

The Day I Lost My First Ten Dollars: My Hunt for the Best Mobile Trading App for Beginners
I still remember the exact shape of the cloud outside my window when my first live trade ended in the red. It was a crisp morning, and I was sitting on my couch with a lukewarm cup of coffee, staring at a flashing line on my smartphone screen. I had just deposited ten bucks, convinced […]

Best Broker for Learning Price Action in 2026 (Tested by Real Traders)
Most traders think they need a better strategy. What they actually need is a better understanding of price. A few years ago, one of our community members had over ten indicators on his chart. RSI. MACD. Moving averages. Bollinger Bands. Stochastic. Every new YouTube video added another indicator. The result? More confusion. Not more profits. […]

Deriv vs IQ Option for Synthetic Indices: Which Platform Is Better in 2026?
Synthetic indices have become one of the most talked about trading categories among beginners and experienced traders alike. Unlike forex or crypto markets that depend on real world events, synthetic indices operate 24/7 using algorithm driven price movements. That means traders can access opportunities at any time without waiting for market openings or major news […]