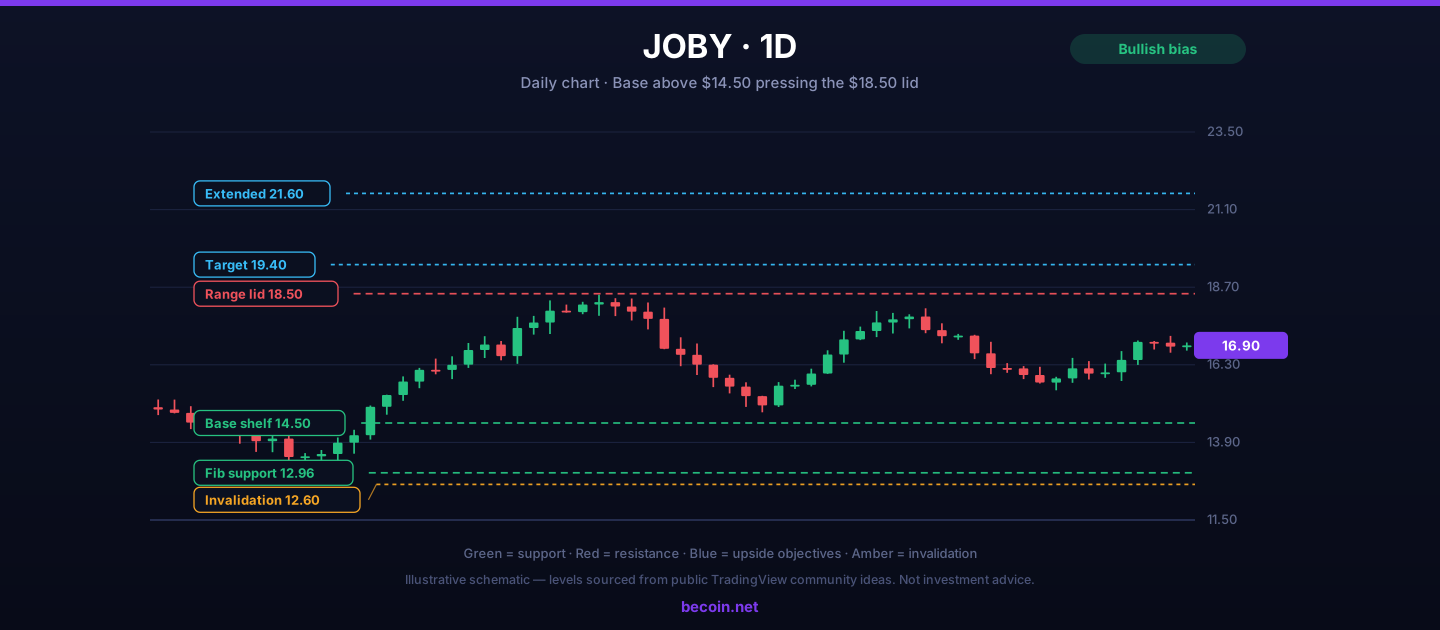
Joby Aviation Forecast: JOBY Builds Above $14.50 Toward $18.50
A pre-revenue story trading on milestones
Joby Aviation is not a stock you value on multiples, because there is barely any revenue to apply one to. It is a stock you value on the probability and timing of regulatory certification, and on the credibility of the capital and partnerships behind it. That makes the chart unusually event-driven: long stretches of drift punctuated by sharp repricings when a milestone lands or slips.
The current structure reflects a market that has decided the company will probably make it, while remaining unwilling to pay much more until the next concrete proof point arrives. Hence a base that keeps holding and a ceiling that keeps rejecting.
What the Joby Aviation forecast depends on
Four levels frame the trade:
- $14.50 is the working base. It has caught pullbacks repeatedly and coincides with the cloud support on higher timeframes.
- $12.96 is the deeper Fibonacci support and the last level before the structure genuinely breaks.
- $17 to $18.50 is the lid. Rallies have stalled inside this band more than once, and clearing it on a weekly close would be the technical event of the year for this name.
- $19.40 and $21.60 are the objectives above the lid, both drawn from prior distribution shelves.
The constructive path
A pullback into $14.50 to $15.20 with invalidation beneath $12.60 gives roughly two dollars of risk against a first objective at the lid. That is a wide stop by percentage terms, which is precisely why position size has to be small in a name this volatile.
The breakout version requires a weekly close above $18.50. Given how thin the overhead structure is above that level, the initial move could be fast, and the retest of $18.50 from above would be the more comfortable place to add.
The milestone calendar is the real chart
Certification progress, flight test hours, manufacturing ramp announcements and commercial partnership news move this stock far more than any technical pattern. A trader who ignores the milestone calendar is effectively trading blind, no matter how clean the levels look.
What breaks the thesis
A weekly close beneath $12.60 ends the base and puts the high single digits back in play. In a pre-revenue company, a technical breakdown of that magnitude usually accompanies a genuine setback: a certification delay, a dilutive capital raise on poor terms, or a partner stepping back.
Dilution deserves specific attention. Companies at this stage fund themselves by issuing equity, and a raise announced into weakness can reset the chart in a single session. That risk cannot be managed with a stop; it can only be managed with size.
Why the sector matters
Advanced air mobility trades as a group. When one operator posts a certification win, the whole complex reprices higher, and when one stumbles, the discount is applied across the board. Watching the peer group gives useful early signal that the JOBY chart alone will not provide.
Traders who want that sector view mapped against the levels can follow the Becoin.net Premium Forecast for updated equity projections, and see what each tier covers on the Becoin.net Tariff Plans page.
How to size a story stock
The honest framing is that this is a venture-style position expressed in public markets. The distribution of outcomes is wide and asymmetric, which argues for a position small enough that a total loss would be irritating rather than damaging, held long enough for the milestone thesis to actually play out.
Trading it tactically around the $14.50 and $18.50 levels is legitimate too, but mixing the two approaches is not. Decide in advance whether the position is a swing trade with a stop or a multi-year hold, because the management rules for those are incompatible.
The bottom line
Joby is a base above $14.50 with a hard lid at $18.50 and a clear invalidation at $12.60. The technical structure is constructive, but the actual driver sits in a regulatory office rather than on the chart. Size accordingly.
This analysis is educational and does not constitute investment advice. Equity trading carries substantial risk of loss.

WTI reaches $89.43 as Brent clears $95 on renewed supply risk
WTI traded near $89.43 while Brent moved above $95 as Middle East shipping risk lifted crude for a fifth session. Key levels, catalysts and invalidation.

How Understanding Market Structure Saved My Day Trading
I remember the exact moment my trading account hit zero for the third time in a single month. It was a rainy Tuesday evening, and I was staring at a 1-minute chart on my laptop screen. The price had been moving up aggressively. It looked like a flawless rocket ship to the moon. I clicked […]

Finding My Perfect Workspace: The Search for the Best Broker for My Daily Trading Routine
The alarm goes off at 6:00 AM. By 6:30 AM, I am sitting in front of my monitors with a steaming mug of black coffee. The house is completely quiet, the market is preparing its next major move, and my charts are completely bare. This is my daily sanctuary. For a long time, this morning […]

Which Broker Is Better for Weekend Trading?
It was a chilly Saturday morning, and while the rest of the world was sleeping in or catching up on shows, I was staring at a completely frozen screen. My usual EUR/USD chart looked like a heart monitor flatlining. The traditional markets were closed. The banks were shut down. For a long time, that was […]

IQ Option vs Deriv Chart Comparison
The Night I Realized My Charts Were Lying to Me It was three in the morning, the exact hour when the market looks either like a goldmine or a psychological hazard. I was sitting in front of two monitors, a lukewarm mug of coffee in hand, watching a critical support level on EUR/USD. On my […]

Why Traders Move from Binomo to Deriv in 2026: The Real Reasons Behind the Switch
If you spend enough time around trading communities, you’ll notice a pattern. Many traders start with Binomo. Then, after a few months, a surprising number begin looking at Deriv. Some switch completely. Others keep both accounts but gradually move most of their trading activity to Deriv. I noticed this trend while talking to beginner traders […]