
Ichimoku Cloud Simplified for Beginners
I still vividly remember the first time I loaded the Ichimoku Kinko Hyo onto my trading screen. I had been reading online forums about legendary technical indicators, and someone claimed that this single tool was all a trader ever needed. Excited, I opened my chart, turned on the indicator, and instantly felt a wave of regret.
My screen looked like someone had dropped a plate of colorful spaghetti across my price candles. Lines were crisscrossing everywhere, shaded areas were floating in mid-air, and a strange trailing line was hanging out way behind the price action. I felt overwhelmed, closed the tab, and went back to basic trendlines.
It took me nearly six months and a string of frustrating trades to realize something important. The Ichimoku Cloud is not complicated; I was simply looking at it the wrong way.
Once you understand what the indicator is actually trying to tell you, it becomes one of the cleanest, most efficient tools in technical analysis. In Japanese, "Ichimoku Kinko Hyo" translates roughly to "one-look balance chart." The goal of creator Goichi Hosoda was to allow a trader to look at a chart for two seconds and instantly know whether to buy, sell, or step away.
In this guide, I will share the exact simplified framework I used to demystify the cloud, eliminate chart confusion, and turn it into a core part of my daily trading routine.
The Day the Cloud Finally Clicked for Me
When I started out, I made the mistake of trying to memorize all five component lines simultaneously while trying to compute formulas in my head. That is a recipe for analysis paralysis.
Everything changed when an experienced mentor asked me a simple question: "If you remove the lines for a second, what is the cloud actually doing?"
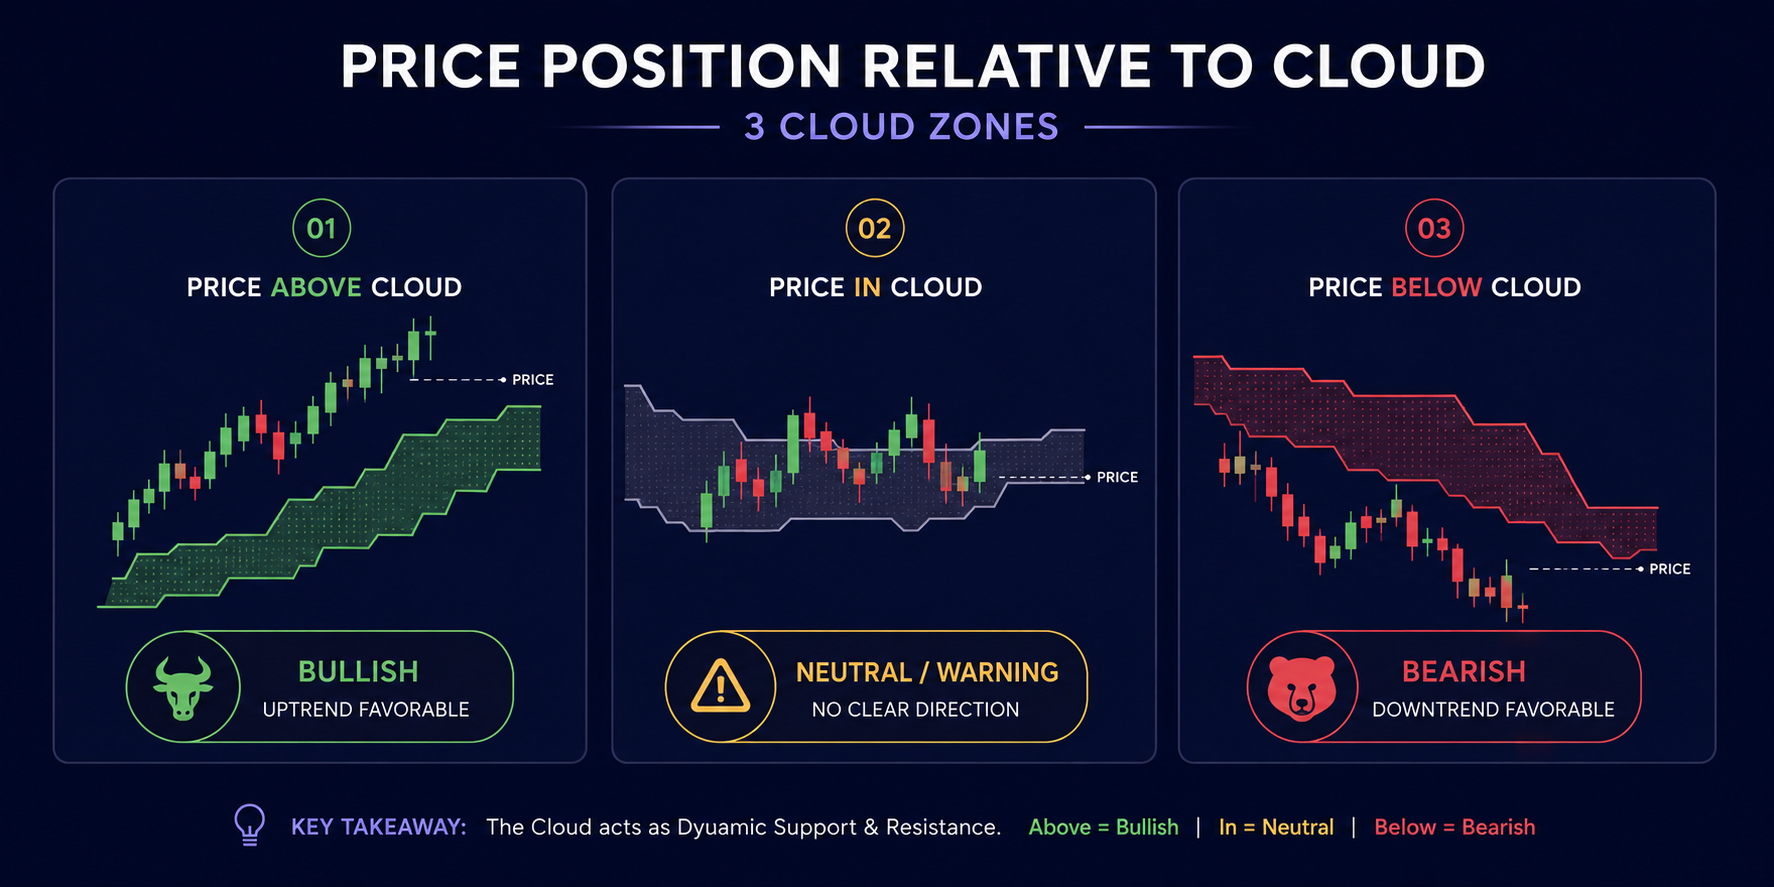
He pointed out that the shaded area on the chart, known as the Kumo or Cloud, acts like dynamic floor and ceiling levels projected into the future. When price sits above the cloud, the market is in a healthy upward trend. When the price is below the cloud, sellers are in control. When price is trapped inside the cloud, the market is lost in fog, and smart traders stay on the sidelines.
That simple perspective shift reframed the indicator for me. Instead of five separate chaotic lines, I began viewing Ichimoku as a story about market balance.
The 5 Elements Made Simple
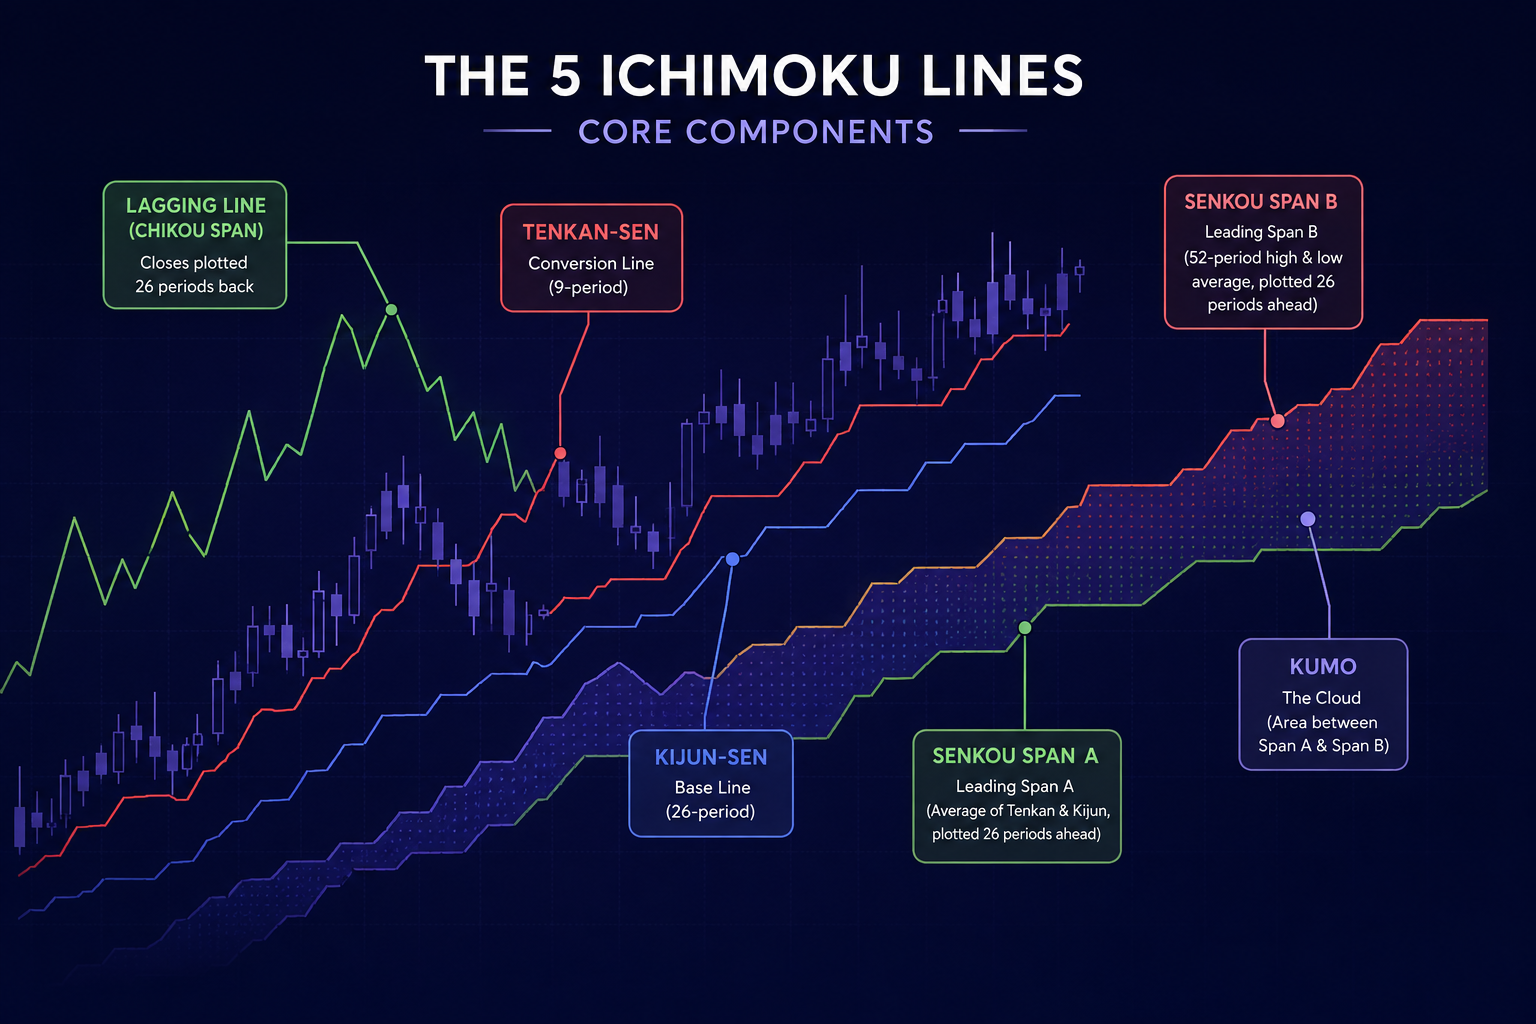
To read the story on your screen, you only need to understand five key elements. Let us break them down using simple analogies rather than intimidating math formulas.
1. Tenkan-sen (The Conversion Line)
This is usually represented as a red line on standard default settings. It measures the midpoint of the highest high and lowest low over the last 9 periods. Think of the Tenkan-sen as a fast-moving sprint runner. Because it reflects short-term price memory, it hugs current candles closely and reacts quickly to sharp momentum shifts.
2. Kijun-sen (The Base Line)
Usually colored blue, the Kijun-sen looks over 26 periods. It represents the medium-term anchor or baseline of the market. Because it covers a longer window, it moves more deliberately than the sprint runner. When price moves too far away from the Kijun-sen, it tends to snap back toward it like a rubber band returning to equilibrium.
3. Senkou Span A and Senkou Span B (The Cloud Boundaries)
These two lines form the outer edges of the shaded Kumo (Cloud).
- Senkou Span A is the average of the Conversion Line and Base Line, pushed 26 periods into the future.
- Senkou Span B is the midpoint of the highest high and lowest low over the last 52 periods, also projected 26 periods ahead.
When Span A is higher than Span B, the cloud turns green or light blue, signaling bullish sentiment ahead. When Span B is higher than Span A, the cloud turns red, signaling bearish resistance. The thicker the cloud, the stronger the support or resistance zone.
4. Chikou Span (The Lagging Line)
This line simply takes today's closing price and plots it 26 periods in the past. Beginners often ignore the Chikou Span because it looks backward, but I consider it my reality check. If the Chikou line is clear of past price candles and open space lies ahead, your trade setup has clean air to move. If it is tangled inside past price bars, you are trading into historical traffic.
My 3-Step Strategy to Read Ichimoku Setups
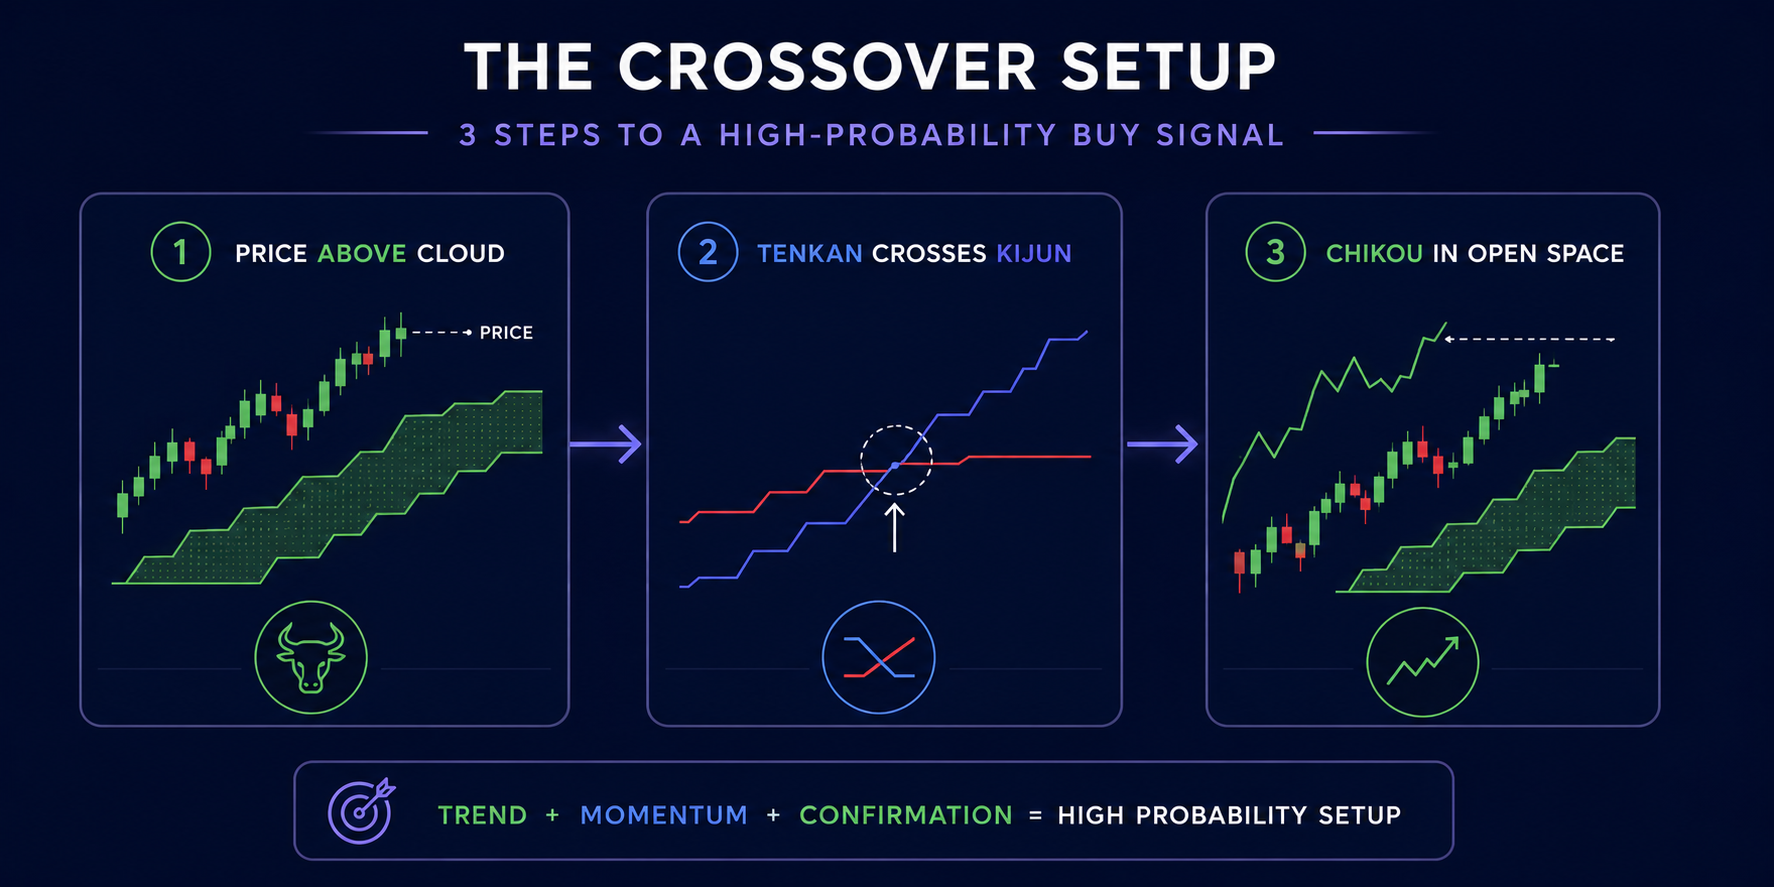
Once I grasped the components, I built a rigid three-step checklist that I still use today before opening any trade. Whether I am analyzingday trading, forex pairs, or digital contracts, this sequence keeps me disciplined.
If you are eager to practice these steps on a clean demo interface, you can test chart setups risk-free on platforms likeIQ Option or set up fast charts onQuotex.
Step 1: Identify the Global Trend Direction
Before looking at signals, I look at where the price sits relative to the Cloud.
- Price above the Cloud: Only look for long (buy) opportunities.
- Price below the Cloud: Only look for short (sell) opportunities.
- Price inside the Cloud: No trade zone. Close the chart and move on.
Step 2: Wait for the Tenkan/Kijun Cross
Just like a moving average crossover, we look for our fast line (Tenkan-sen) to cross our baseline (Kijun-sen).
- Bullish Crossover: Tenkan crosses above Kijun while price is above the cloud.
- Bearish Crossover: Tenkan crosses below Kijun while price is below the cloud.
When practicing trade execution across various execution models, I often test these crossovers across modern multi-asset suites likePocket Option or flexible binary trading terminals onOlymp Trade.
Step 3: Confirm with the Chikou Span
Finally, look at the Lagging Line. Is it floating in open space above or below past candles? If yes, the signal is verified. If the Lagging Line is bouncing against candles from three weeks ago, hold off until space opens up.
Traders who prefer trading derivative contracts or synthetics can test these confirmation techniques on specialized brokers such asDeriv, while those looking for fast registration and simple layouts might exploreExpert Option or streamlined execution platforms likeCapital Core.
Hard Lessons Learned: Mistakes I Made so You Don't Have To
When I first started taking live signals, I made a few avoidable errors that cost me capital.
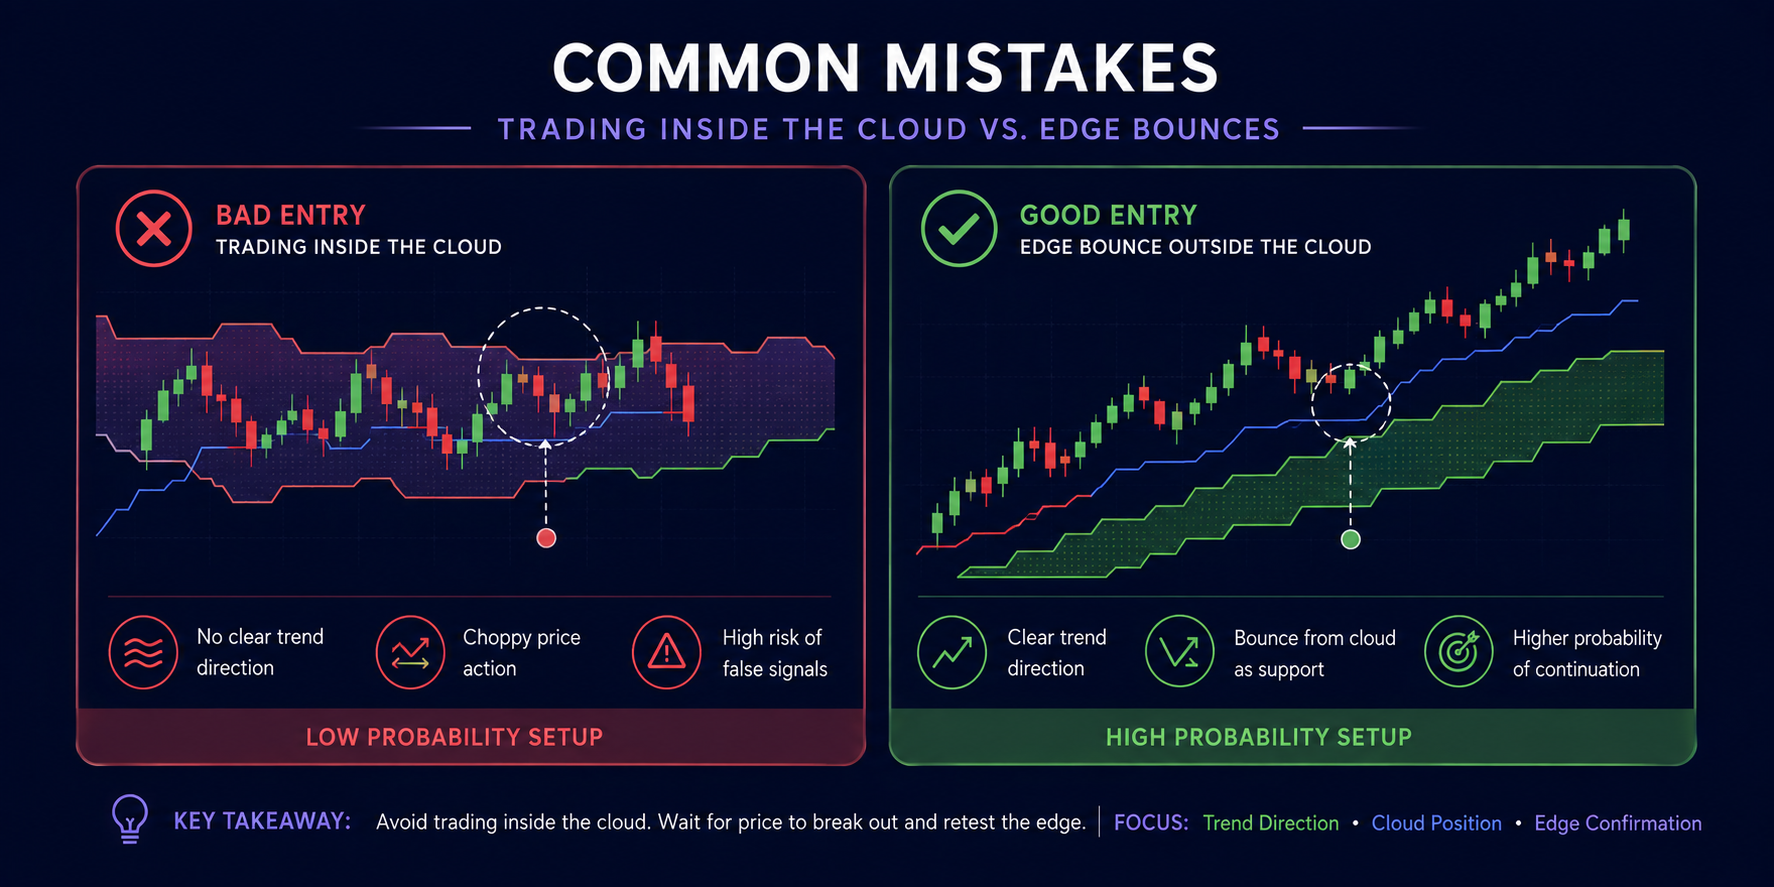
First, I fell into the trap of trading inside the cloud. During tight consolidation, prices will frequently bounce around inside the Kumo. The Tenkan and Kijun lines will cross each other repeatedly, generating false signals every few hours. Learning to treat the cloud as a strict filter kept me away from low-probability trades.
Second, I focused solely on the indicator while completely forgetting general market structure and money management. No single indicator, no matter how famous, boasts a 100% win rate. Combining the Ichimoku Cloud with essential risk management principles and classic candlestick price action provides a far stronger foundation. For a deeper dive into core foundational strategies, I recommend studying our comprehensive guides on theBeCoin Technical Analysis Blog, where we break down structural chart patterns and risk-to-reward mechanics in detail.
Taking Your Technical Analysis to the Next Level
Mastering the Ichimoku Cloud gives you an immediate advantage in reading market momentum, identifying dynamic support levels, and ignoring bad market noise. However, applying technical tools consistently across volatile market conditions requires structured guidance and reliable market data.
If you are ready to eliminate guesswork and trade with professional precision, explore theBeCoin Premium Tariff Plan. By upgrading, you gain access to real-time market insights, in-depth technical breakdowns, and structured educational modules designed to refine your trading edge.
To complement your chart analysis with institutional-grade research and live scenario mapping, make sure to visit theBeCoin Forecast Hub. Having precise market forecasts alongside your simplified Ichimoku workflow ensures you stay ahead of high-impact market moves.

Chasing Safety in a High-Stakes World: My Quest for the Best Low-Risk Trading Platforms
I still remember the sinking feeling in my stomach when I lost my first tiny trading account. It wasn’t a massive fortune, but it was mine. That night, I realized a brutal truth about this industry: most beginners fail not because they lack passion, but because they dive into high-risk environments without a life jacket. […]

The Day I Lost My First Ten Dollars: My Hunt for the Best Mobile Trading App for Beginners
I still remember the exact shape of the cloud outside my window when my first live trade ended in the red. It was a crisp morning, and I was sitting on my couch with a lukewarm cup of coffee, staring at a flashing line on my smartphone screen. I had just deposited ten bucks, convinced […]

Can You Start Trading with $10 on Deriv?
A lot of beginners enter trading with the same question: “Is $10 actually enough to start trading on Deriv?” The short answer is yes. But the real answer is more complicated. You can start with $10 on Deriv, but whether you can survive, learn, and grow that account depends entirely on your expectations, discipline, and […]

Safest Broker for Small Deposits in 2026
Looking for the safest broker for small deposits in 2026? Discover beginner-friendly trading platforms with low minimum deposits, reliable withdrawals, risk controls, and the best options for starting safely with limited capital. Starting trading with a small amount of money sounds easy until you actually deposit real funds. Most beginners quickly realize that choosing the […]

Which Broker Has Faster Withdrawals? Real 2026 Comparison for Traders
When most beginners choose a broker, they focus on bonuses, signals, or flashy interfaces. But after trading for a while, you realize one thing matters more than almost anything else: How fast can you actually withdraw your money? A broker can look perfect until your first withdrawal request gets stuck in “processing” for three days. […]

Deriv vs IQ Option for Synthetic Indices: Which Platform Is Better in 2026?
Synthetic indices have become one of the most talked about trading categories among beginners and experienced traders alike. Unlike forex or crypto markets that depend on real world events, synthetic indices operate 24/7 using algorithm driven price movements. That means traders can access opportunities at any time without waiting for market openings or major news […]