How to Stay Patient Between Setups
You stay patient between setups by planning the interval instead of enduring it: log the trade you just closed, leave the screen for fifteen minutes, study closed charts rather than live ones, then set price alerts and shut the platform. Patience fails when the waiting time is unstructured, not when willpower runs out.
Key takeaways
- Waiting is not a character trait. It is an unmanaged block of time, and time can be scheduled.
- In 66,465 US households studied over six years, the least active fifth of traders earned 18.5% a year net while the most active fifth earned 11.4% — a 7.1-point gap produced almost entirely by trading more.
- The urge to act on a quiet screen is a documented feature of an idle mind: in a 2014 Science study, 67% of male participants gave themselves an electric shock they had earlier paid money to avoid, rather than sit alone with their thoughts for fifteen minutes.
- You cannot decide to stop feeling restless. You can decide in advance what your hands do while you feel it — that gap is where every workable rule lives.
- Reframing helps and is measurable: instructing people to think like a trader reduced their loss aversion by an average of 16% in a PNAS study.
- Time already spent waiting is a sunk cost. It is never evidence that the setup in front of you is good enough.
Why the gap between setups is the hardest part of trading
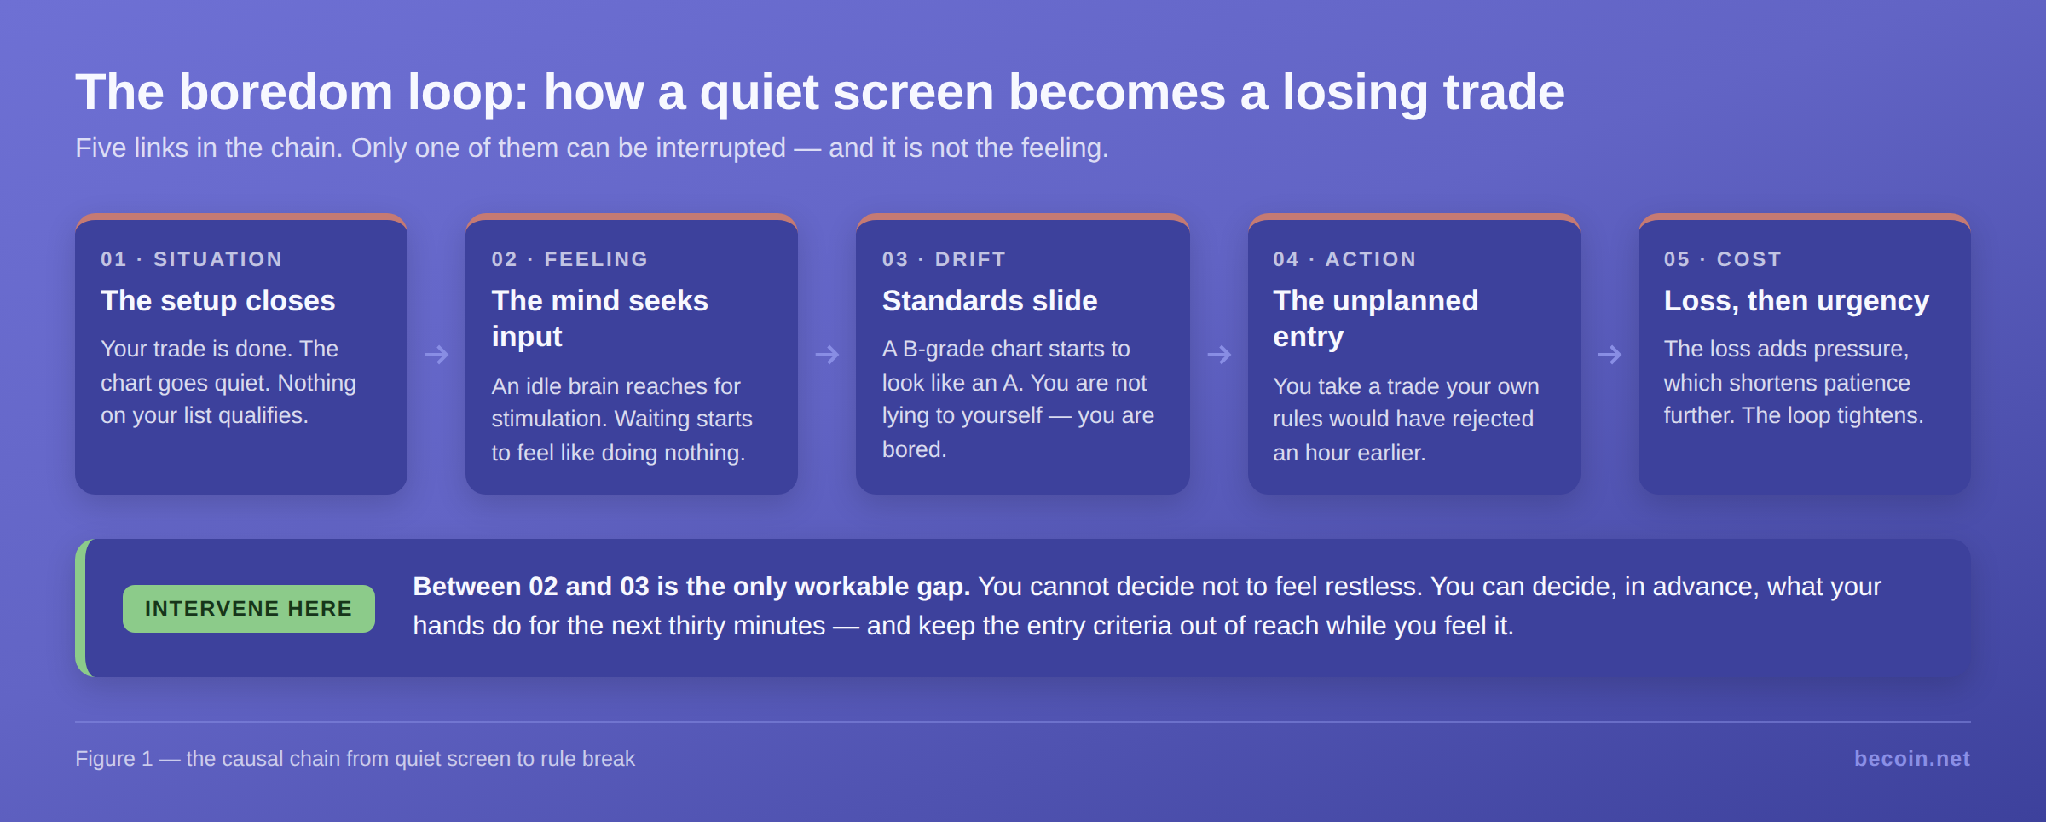
The gap between setups is hard because it is the only part of trading with no task attached to it. Entries have criteria. Exits have criteria. Risk has a formula. The three hours in between have nothing — and an unstructured block of time in front of a live price feed is where good plans go to die.
Most advice on this subject argues that patience matters. That is not the problem. Nobody sits at a desk at 11am believing patience is worthless; they sit there with 180 empty minutes, a chart that keeps moving, and no instructions. The question is not whether to wait. It is what to actually do while waiting.
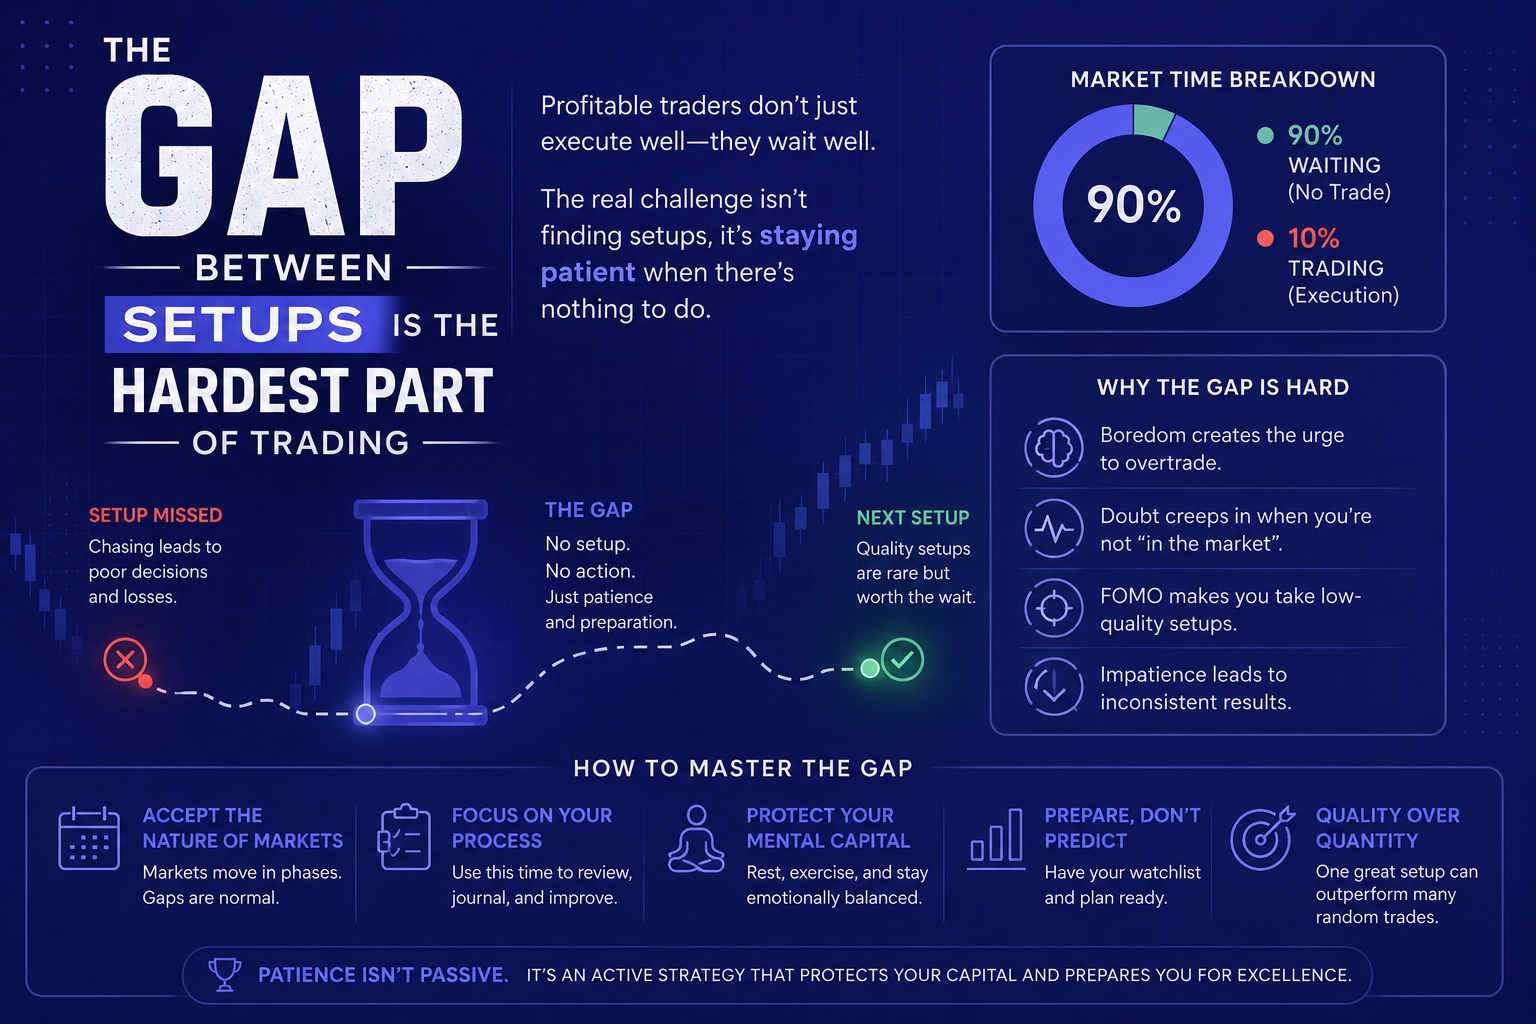
It helps to be precise about the mechanism, because the popular version is wrong. Boredom does not cause a bad trade directly. It causes a drift in standards, and the drift is invisible while it is happening. A chart you would have graded a B at 9am starts to look like an A at 1pm, not because the chart improved but because your tolerance for doing nothing has run down. By the time you enter, the trade feels justified. This is the same machinery behind every other emotional pattern that costs traders money, and it is why arguing with the feeling never works.
There is direct evidence that idleness itself is aversive. In a series of experiments published in Science in 2014, Timothy Wilson and colleagues left participants alone in a room with nothing but their thoughts for six to fifteen minutes. Most found it unpleasant. In the final study, participants were given the option of self-administering an electric shock — one they had already sampled and said they would pay money never to feel again. Even so, 67% of men (12 of 18) and 25% of women (6 of 24) shocked themselves at least once rather than simply sit and think (Wilson et al., Science, 2014). A trading platform offers something far more tempting than a shock button: a button that might pay.
What impatience actually costs: the numbers nobody cites
Search this topic and you will find a great deal of conviction and almost no evidence. It is worth looking at what has actually been measured, because the size of the effect is larger than the advice usually implies.
The cleanest number comes from Brad Barber and Terrance Odean, who tracked 66,465 US households at a discount broker from 1991 to 1996. The average household earned 16.4% a year net against a market return of 17.9%. That gap is unremarkable. The gap inside the sample is not: sorted by portfolio turnover, the least active fifth of households earned 18.5% a year, and the most active fifth earned 11.4% (Barber & Odean, Journal of Finance, 2000).
| Group (sorted by turnover) | Annual portfolio turnover | Net annual return | Versus the 17.9% market return |
|---|---|---|---|
| Least active fifth | About 2% | 18.5% | +0.6 points |
| Average household | Over 75% | 16.4% | −1.5 points |
| Most active fifth | About 258% | 11.4% | −6.5 points |
Read that table again with the waiting hours in mind. Nobody in the most active group set out to give away seven percentage points a year. They filled empty time, one reasonable-looking trade at a time.
The pattern holds where the data is more brutal. Fernando Chague, Rodrigo De-Losso and Bruno Giovannetti followed every individual who took up day trading in Brazilian equity futures between 2013 and 2015. Of the 1,551 who persisted for more than 300 trading days, 97% lost money net of fees, and 1.1% earned more than the Brazilian minimum wage (Chague, De-Losso & Giovannetti, 2020). Persistence, on its own, was not the variable that separated them — a point worth holding onto when you look at the wider day trading success rate data.
Regulators see the same shape from the other side. When ESMA reviewed the retail contract-for-difference market on 27 March 2018, national regulators reported that 74–89% of retail accounts lost money, with average losses per client between €1,600 and €29,000 (ESMA, March 2018). Not all of that is impatience. But overtrading is the most common route from a strategy that tests well to an account that does not.
There is also evidence on the state you are in while you wait. Andrew Lo, Dmitry Repin and Brett Steenbarger followed 80 anonymous day traders over a five-week period, collecting emotional-state and performance reports. Traders whose emotional reaction to gains and losses was more intense — in both directions — showed significantly worse performance (Lo, Repin & Steenbarger, NBER, 2005). Elation after a win is a risk factor in the same way frustration after a loss is.
What counts as an A+ setup — and how many you should expect
“Wait for A+ setups” is the most repeated instruction in trading and one of the least useful, because almost nobody defines the grade. A standard you cannot state in writing is a standard that bends under boredom, which is exactly when you need it not to.
Write your criteria down as a scorecard and keep it beside the screen — physically, on paper, not in a file you have to open. The point is that grading happens before sizing, and that a missing criterion ends the conversation regardless of how long you have been waiting.
| Criterion | What passes | What fails |
|---|---|---|
| Location | Price is at a level you marked before the session opened | A level you drew in the last ten minutes |
| Higher-timeframe agreement | The 4-hour and daily structure point the same way | Timeframes disagree and you pick the one that suits |
| Trigger | Your named entry pattern has completed and closed | The candle is still forming and “looks like” it will |
| Risk-to-reward | A defined invalidation gives at least your minimum multiple | The target has been stretched to make the ratio work |
| Event risk | No high-impact release inside your holding window | A release is due and you are “probably fine” |
| Session | Inside the hours you actually tested | Outside them, because nothing appeared during them |
The second half of the answer is frequency, and it is the number that makes waiting survivable. If your criteria are genuinely selective, most sessions will produce nothing. Traders who track this honestly usually find their edge appears a handful of times a week rather than several times a day, which reframes an empty afternoon as normal output rather than a failure. It is worth working out, from your own records, how many trades you should actually be taking in a day before you decide that today has been unusually quiet.
That expectation changes what an idle screen means. If you know your setup appears roughly four times a week, then four hours of nothing is the process working. If you have never counted, every quiet hour feels like evidence that you are missing something. Traders who take this to its conclusion — and there is a case for running a one-trade-a-day approach — are not being heroic. They have simply made the expected count explicit.
The between-setup protocol: what to do in the waiting hours
Here is the part every competing article leaves out. Below is an hour of waiting, planned in advance. It is deliberately mundane, because the goal is not to make waiting enjoyable — it is to make it uneventful.
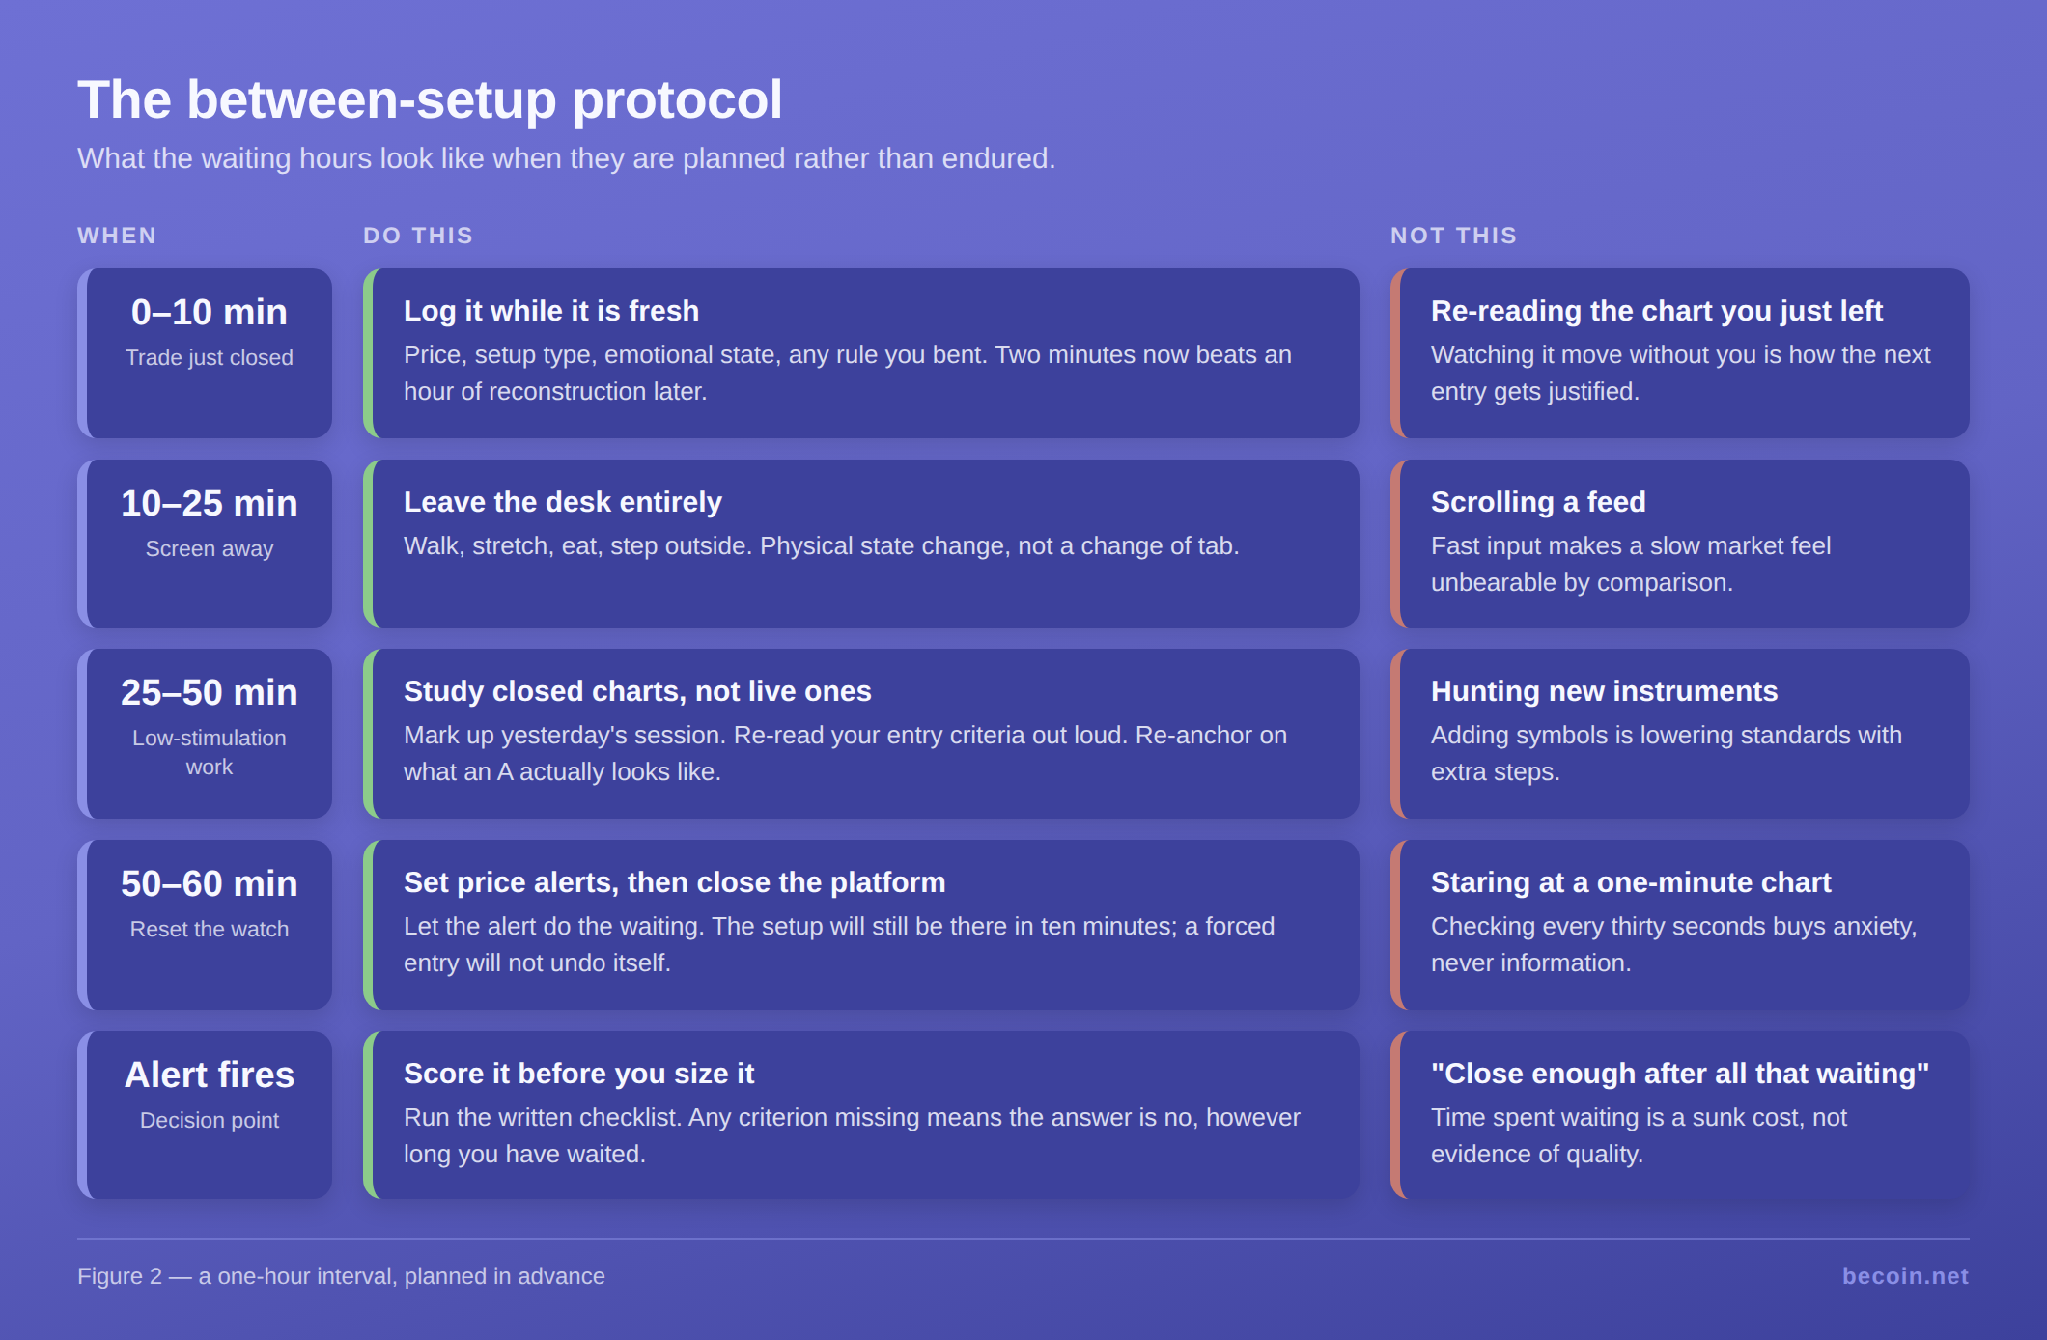
Two design principles are doing the work here. The first is that every block has a defined task, so there is no unallocated time in front of a live chart. The second is that the entry criteria are physically out of reach during the restless part of the interval — the platform is closed, and an alert is what brings you back. You are not relying on judgement at the moment judgement is weakest.
The alert step matters more than it looks. Watching a chart for an hour does not give you more information than checking it when a level is reached; it gives you an accumulating sense of involvement that makes the eventual entry feel owed. Setting alerts and closing the platform converts an hour of vigilance into a single decision. If you do not already have a fixed shape to your trading day, this protocol slots into a simple daily trading routine without much rearranging.
One caution on the physical break: change your state rather than your tab. Standing up, walking outside and coming back is not the same activity as switching to a news feed for fifteen minutes. Rapid, high-variance input makes a slow market feel intolerable by comparison, which is the precise condition you are trying to avoid.
It is worth doing one piece of mental work during the interval, and there is evidence for which piece. Peter Sokol-Hessner and colleagues asked participants to consider each monetary choice as one of many — to imagine themselves a trader building a portfolio rather than reacting to a single bet. That instruction alone reduced measured loss aversion by an average of 16% (Sokol-Hessner et al., PNAS, 2009). Applied here it means treating the setup you are waiting for as one of the roughly two hundred you will take this year, not as the one that decides the week.
Rehearse the protocol where a mistake is free. Run a full session on a demo account and grade every setup you did not take. A demo removes the money, which is exactly what you want while you are testing whether the routine holds — the habit is what you are training, not the P&L. Open a free Deriv demo account and trade a week without taking a single B-grade entry.
Affiliate disclosure: BeCoin may earn a commission if you open an account through this link, at no additional cost to you. Trading carries risk of loss.
A worked example: what one bored hour costs over a month
Abstractions do not change behaviour; arithmetic sometimes does. The following is an illustration, not a projection, and the numbers are chosen to be easy to follow rather than to describe any particular market.
Take a trader with a $5,000 account who risks 1% — $50 — per trade. Their tested setup has a 45% win rate at 2R, which gives an expectancy per trade of (0.45 × $100) − (0.55 × $50) = $45 − $27.50 = $17.50. The setup appears four times a week, so 16 planned trades a month return 16 × $17.50 = $280.
Now add one bored entry per day. These are the B-grade charts taken in the third empty hour. Assume they perform worse than the tested setup but not catastrophically — a 33% win rate at the same 2R, because the entry is late and the invalidation is wider. Expectancy per trade is (0.33 × $100) − (0.67 × $50) = $33 − $33.50 = −$0.50. Across 20 trading days that is −$10, which sounds harmless.
It is not harmless, and the reason is the part the arithmetic above does not show. Those 20 extra trades take the month from 16 positions to 36, more than doubling the spread and commission drag. The expensive part is subtler: they add losses that arrive while a planned setup is live, which is how a sensible risk decision turns into a widened stop. Cut the win rate on the bored trades to 30% and the month goes from +$280 to +$180 before costs. That is a 36% reduction in the month’s output, produced entirely by time management. Barber and Odean’s most active quintile lost 6.5 points a year to a version of the same trade.
Run your own version of this with your real numbers rather than these. The position size calculator will give you the per-trade risk figure to start from, and the expectancy follows from your own win rate and average multiple.
If the per-trade risk itself is what moves around when you are restless — bigger after a loss, bigger again out of boredom — that is a separate and more urgent problem than entry timing. Protecting capital comes before refining entries, and no amount of patience survives a sizing habit that changes with your mood.
One more note on the arithmetic: a B-grade trade does not need a negative expectancy to hurt you. It only needs a lower expectancy than the A-grade trade it displaces attention from, plus the cost of the emotional state it leaves you in for the next one.
Journal the trades you did not take
Almost every trading journal records entries. Almost none records refusals, which means the single behaviour you are trying to build leaves no evidence behind. If waiting produces nothing you can look at on Friday, your brain has no reason to keep doing it.
The fix is small. Every time you pass on a setup, write one line: the instrument, which criterion failed, and what the chart did afterwards. Check it at the end of the week. Most traders discover two things. The first is that the majority of the trades they refused would have lost — which converts an abstract virtue into a running tally. The second is that one or two would have won, and that seeing this in writing is much less destabilising than imagining it.
This is also the fastest way to find out whether your criteria are calibrated. If nine out of ten refusals were correct, the standard is doing its job. If most of them would have worked, the standard is not selective — it is arbitrary, and it is costing you trades rather than saving you from them.
The free BeCoin trading journal is built for exactly this. Every entry takes a setup type, an emotional state — calm, confident, anxious, FOMO, revenge, greedy — and a mistake tag such as late entry, over-sized, rule breach or moved stop. Log the refusals with the same tags, not only the entries.
The pattern becomes visible within a fortnight: which emotional state precedes your rule breaches, and which hour of the session they cluster in. Traders who do this usually recognise their own specific emotional triggers long before they can explain them — the tally arrives before the insight does, which is the right order.
Patience, discipline, hesitation and fear are four different things
These terms get used interchangeably, which is a problem, because the fix for one is the opposite of the fix for another. Telling a hesitant trader to be more patient makes them worse.
| Term | What it actually is | How it shows on the screen | What it costs |
|---|---|---|---|
| Patience | Waiting for a defined condition you have written down | No position, alerts set, platform closed | Nothing, if the criteria are calibrated |
| Discipline | Executing the plan once the condition is met | Entry taken at the trigger, size unchanged | Nothing — it is the payoff of patience |
| Hesitation | The condition is met and you do not act | Watching your setup run without you | The trades your edge depends on |
| Fear | A prior loss is driving the decision, not the chart | Skipping valid setups after a losing day | The recovery, and eventually the strategy |
The diagnostic is simple: check whether your scorecard passed. If all six criteria were met and you did not take the trade, that is hesitation, and more waiting will not fix it. If they were not met, you were right, and the empty screen is the plan working. This is why the written scorecard earns its place — without it you cannot tell the two apart after the fact, and you will tell yourself whichever story is more comfortable. Building genuine trading discipline starts with being able to make that distinction honestly.
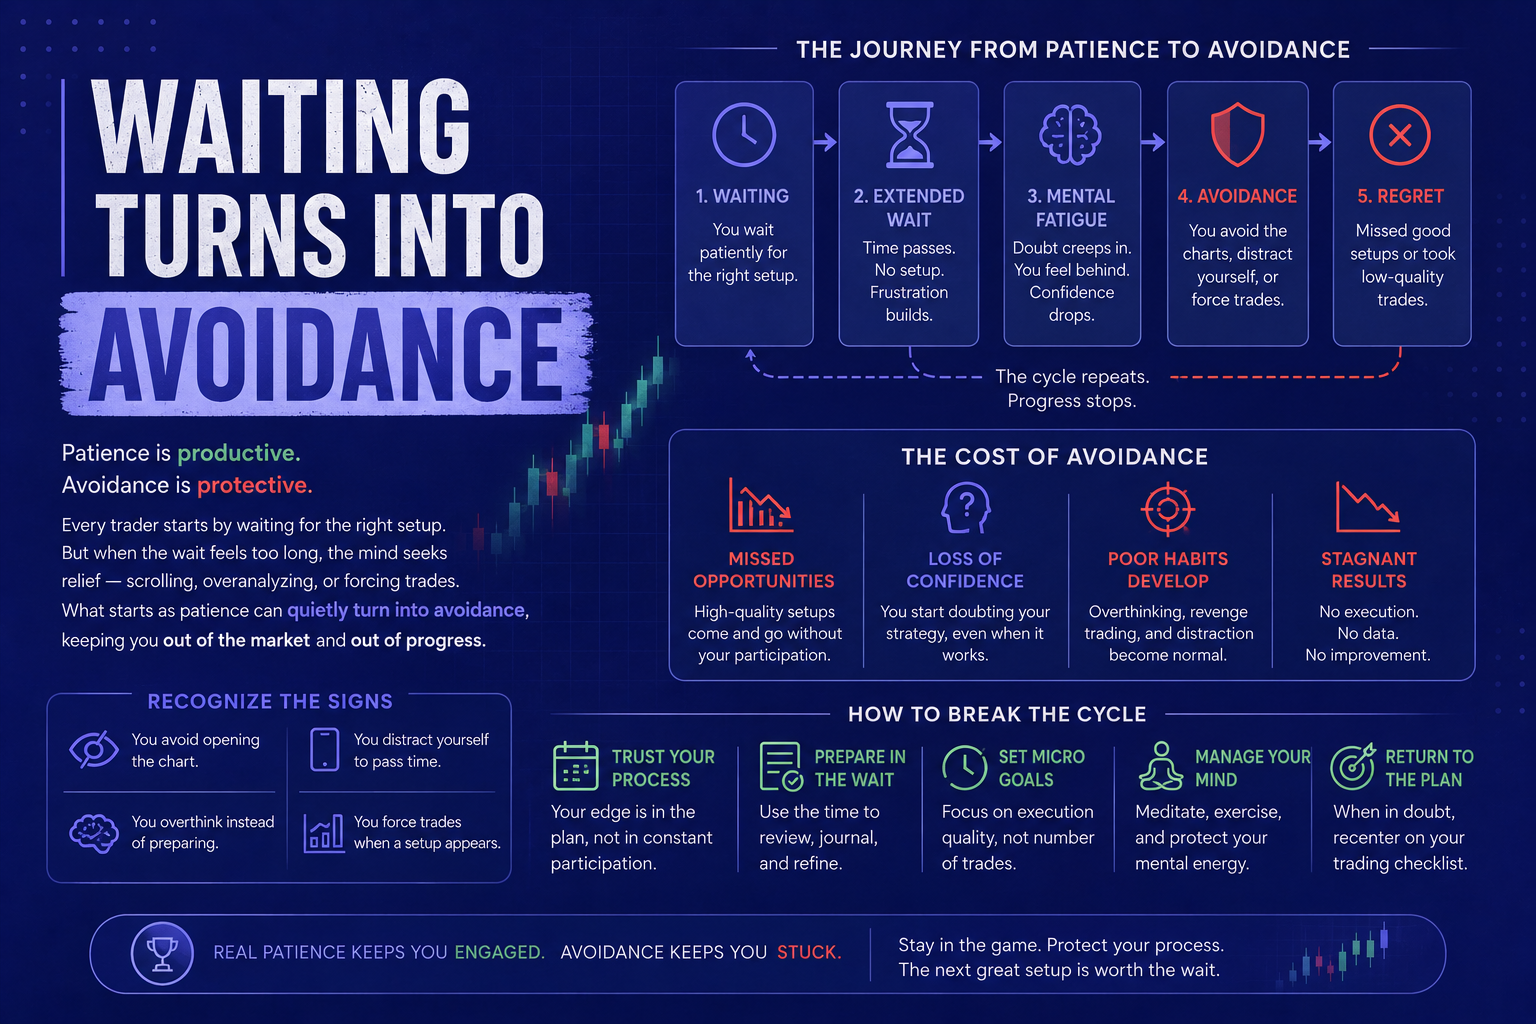
When waiting turns into avoidance
There is a failure mode on the other side, and it is more common among traders who have read a lot about patience. Standards ratchet upward until nothing qualifies, the account stops moving, and the trader congratulates themselves on their discipline. What has actually happened is that a losing week made execution painful, and raising the bar is a socially acceptable way of not executing.
Three signs it has happened. Your criteria have grown since the last drawdown and you cannot say when. You are finding new reasons to reject trades that would have passed a month ago. And the setups you skip are disproportionately the ones in the direction of your last loss.
The remedy is not to loosen your standards, which would undo the work. It is to fix the criteria in writing, date them, and stop editing them mid-week. Any change to the scorecard should come from reviewed evidence at the weekend, never from how yesterday felt.
If executing at all has become the difficulty, dropping back to a demo environment for a week restores the mechanics without the stakes. Take every setup that scores, at a fixed size, and see whether the hesitation was about the market or about the money.
And if the reluctance traces back to one particular loss, the useful work is on how you process losing trades rather than on the entry rules. No scorecard fixes a flinch.
Design a session with less waiting in it
The final move is structural. A great deal of what traders call impatience is a scheduling problem: they are sitting at the screen during hours when their setup has no reason to appear, and then blaming their temperament for what happens next.
Two questions settle most of it. Which hours does your edge actually occur in — measured from your own records rather than assumed? And are you at the desk outside them? A trader whose setups cluster in the London–New York overlap and who sits watching from 6am has manufactured five hours of avoidable waiting. Matching screen time to the hours your instruments actually move removes more temptation than any amount of willpower.
The second structural fix is preparation. Levels marked before the session, on a fixed watchlist, mean the waiting hours have nothing to decide — the work is already done, and the alert either fires or it does not. Doing that preparation from a prepared set of cross-asset levels and forecasts takes less time than the hour of drifting it replaces.
None of this is glamorous, and that is rather the point. Waiting well looks like an ordinary hour with a task in it, repeated until the setup arrives.
FAQs
How do you master patience in trading?
You do not master the feeling; you remove the conditions that make it decisive. Write your entry criteria as a scorecard, know how many setups to expect in a week, schedule the interval between them with defined tasks, and use price alerts so the platform is closed while you are restless. Patience becomes a routine rather than an act of will.
What is the 3-5-7 rule in trading?
It is a risk-limit convention: no more than 3% of your account at risk on a single trade, no more than 5% on any one correlated theme, and no more than 7% at risk across all open positions at once. It is a rule of thumb rather than a regulated standard, and many traders run considerably tighter limits — 1% per trade is common. It caps damage; it does not improve entries.
What is the 90% rule in trading?
The phrase usually refers to the claim that 90% of traders lose 90% of their capital within 90 days. There is no single study establishing that figure, so treat it as folklore. Verified numbers exist and are sobering enough: ESMA reported in March 2018 that 74–89% of retail CFD accounts lose money, and a study of Brazilian day traders found 97% of those who persisted beyond 300 days lost money net of fees.
Why do most day traders lose money?
Costs and frequency, mainly. Barber and Odean found the most active fifth of US households returned 11.4% a year against 18.5% for the least active fifth, over the same period in the same market. Trading more meant paying more in spreads and commissions while taking lower-quality entries. Behavioural patterns compound it — realising winners too early, holding losers too long, and increasing size after a loss.
How do you deal with boredom while trading?
Treat it as scheduled downtime rather than something to push through. Leave the desk for a genuine break, do low-stimulation work such as marking up closed charts, and avoid fast-input substitutes like social feeds, which make a slow market feel worse by comparison. Above all, set alerts and close the platform — boredom is only dangerous within reach of an order ticket.
What causes a lack of patience?
An idle mind seeks stimulation, and a trading platform supplies it on demand. The 2014 Science experiments found many participants preferred a self-administered electric shock to fifteen minutes alone with their thoughts. Add an open position’s worth of anticipation, a recent loss, or an unclear plan, and the urge to act becomes the path of least resistance.
Is it bad to not trade for a while?
No, provided the abstinence is criteria-driven. If your setups genuinely appear four times a week, three quiet days are the plan working. It becomes a problem when your standards have quietly risen since your last drawdown and you can no longer say what changed — that is avoidance rather than patience, and it needs a different fix.
Does reframing how you think about waiting actually help?
There is measurable evidence that reframing changes risk behaviour. In a 2009 PNAS study, participants told to consider each choice as one of many, as a trader would, showed loss aversion reduced by an average of 16% compared with their unregulated baseline. That is a real effect from an instruction alone — though it is a supplement to written rules, not a replacement for them.
The next step
Start with the two smallest pieces. Write your six entry criteria on paper tonight and put them beside the screen. Tomorrow, log every setup you refuse and which criterion failed. By Friday you will have something the waiting hours have never produced before — a record of the trades you did not take, and evidence about whether your standard is calibrated or merely strict.
Everything else in this article is built on those two habits. The protocol makes the interval uneventful; the scorecard makes the decision automatic; the refusal log makes both of them visible enough to keep doing.
Waiting is easier when the preparation is already done. BeCoin Premium gives you the marked levels, cross-asset forecasts and session planning that turn an empty hour into a scheduled one — so the work happens before the session, not during the restless part of it. See what BeCoin Premium includes.

Safest Broker for Small Deposits in 2026
Looking for the safest broker for small deposits in 2026? Discover beginner-friendly trading platforms with low minimum deposits, reliable withdrawals, risk controls, and the best options for starting safely with limited capital. Starting trading with a small amount of money sounds easy until you actually deposit real funds. Most beginners quickly realize that choosing the […]

Can You Start Trading with $10 on Deriv?
A lot of beginners enter trading with the same question: “Is $10 actually enough to start trading on Deriv?” The short answer is yes. But the real answer is more complicated. You can start with $10 on Deriv, but whether you can survive, learn, and grow that account depends entirely on your expectations, discipline, and […]

Which Broker Has the Cleanest Interface? Real Comparison for Beginners in 2026
Looking for the cleanest trading interface in 2026? Compare Binomo, IQ Option, Quotex, Deriv, and more based on speed, layout, usability, mobile experience, and beginner friendliness. When most beginners choose a broker, they focus on bonuses, payouts, or deposit methods. But after testing multiple platforms for months, I realized something surprising: A messy interface can […]

Deriv vs IQ Option for Beginners in 2026: Which Platform Is Better to Start With?
Choosing your first trading platform can decide whether you stay consistent or quit after blowing your first account. Most beginners do not fail because trading is impossible. They fail because they start on platforms that confuse them, encourage emotional trading, or make risk management difficult. Two names that often appear in beginner discussions are Deriv […]

Simple Daily Trading Routine for Consistency
Most traders do not fail because of strategy alone. They fail because they are random. They trade when emotional, skip planning, increase risk after losses, and ignore review sessions. Consistency in trading usually comes from routine more than prediction. A simple daily trading routine helps you stay disciplined, reduce emotional mistakes, and improve decision making […]