
How to Calculate Your Real Edge in Day Trading
I still remember the night I blew my third $500 trading account.
It was 2:15 AM. My eyes were bloodshot from staring at 1-minute candlestick charts, and my heart was pounding. I couldn't understand what had gone wrong. My trading strategy had an alleged 60% win rate during backtesting. I was calling the "Call" and "Put" options with total confidence. Yet, every week ended the exact same way: a slow, agonizing drain of my account balance until I hit zero.
I thought I was just unlucky. I thought the market was rigged against me.
Then I sat down with a legal pad, drew a line down the middle, and ran the cold, hard mathematics of fixed-return contracts. That was the moment I realized a painful truth: A 60% win rate in day trading can still lose you money.
If you are treating day trading like a simple coin toss where you just need to be right more than half the time, you are playing a game designed to wipe you out. To survive and consistently extract capital from these markets, you must learn how to calculate your Real Edge.
The Illusion of High Win Rates
When I first started trading on popular modern platforms like Binomo and IQ Option, I fell into the standard rookie trap. I focused entirely on hit rate. If 6 out of my 10 trades hit target, I felt like a financial genius.
Here is the math I ignored back then:
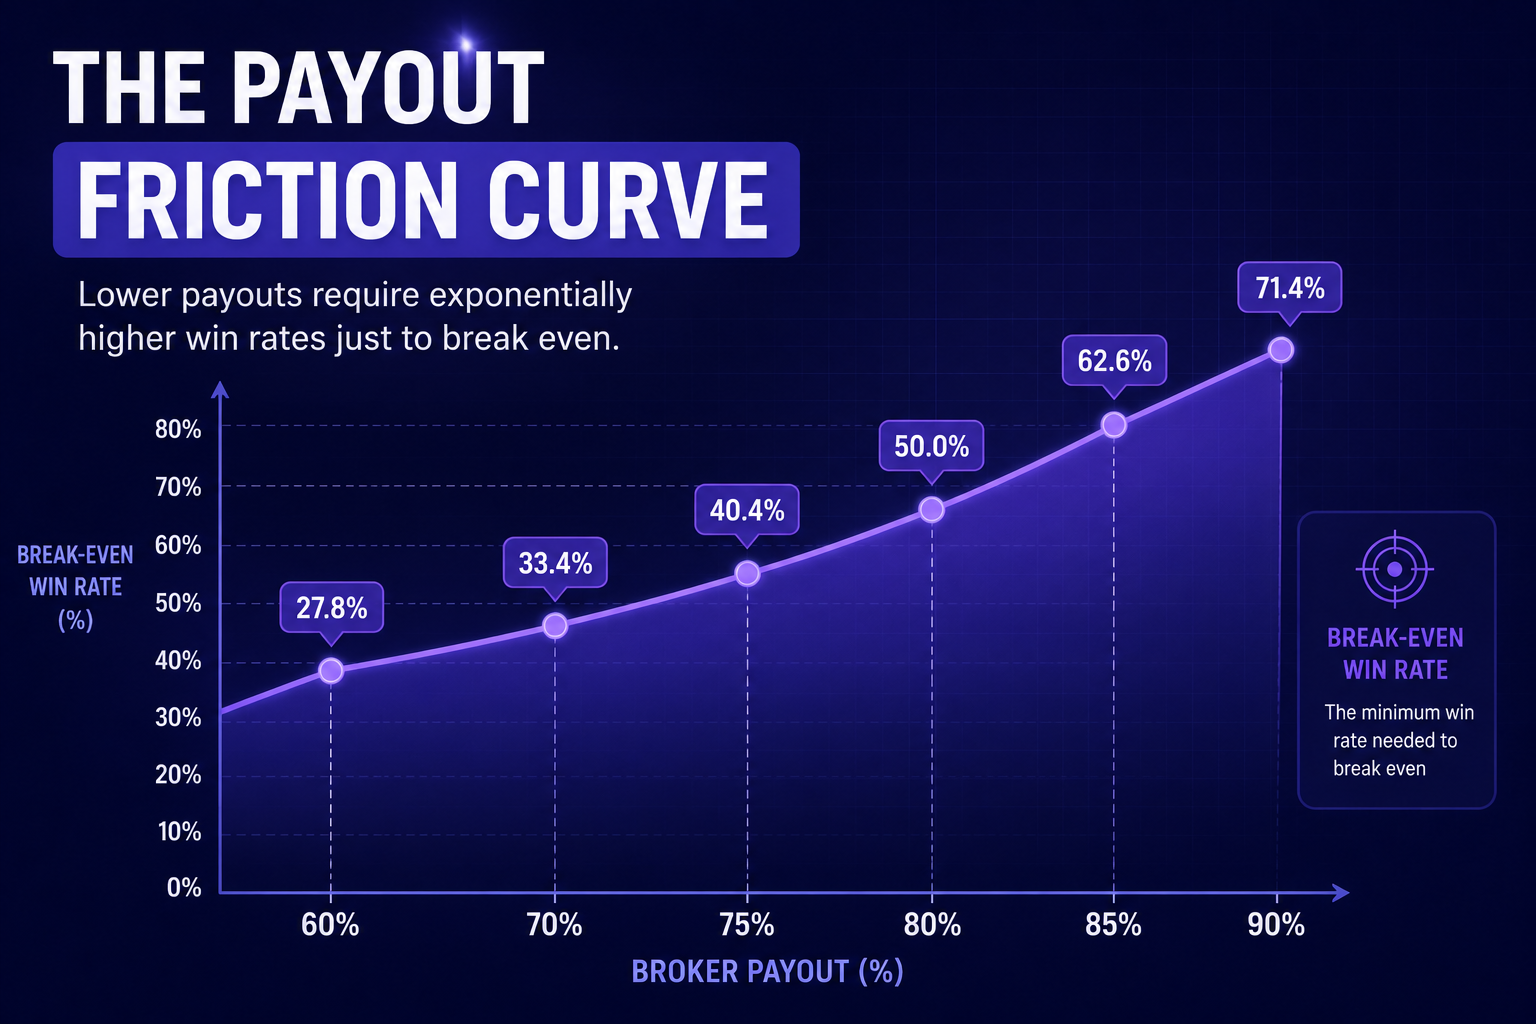
In standard financial markets, a 1:1 risk-to-reward ratio means when you win, you make $100, and when you lose, you lose $100. But day trading brokers operate on payout percentages—typically between 70% and 85%.
Imagine you take 10 trades at $100 per trade on a broker offering an 80% payout:
- Wins: 6 trades × $80 profit = +$480
- Losses: 4 trades × $100 loss = -$400
- Net Profit: +$80
At a 60% win rate with an 80% payout, you make a tiny profit. But what happens when broker payouts fluctuate down to 70% during lower volatility sessions?
- Wins: 6 trades × $70 profit = +$420
- Losses: 4 trades × $100 loss = -$400
- Net Profit: +$20
Suddenly, a minor 10% shift in the broker's payout structure destroys 75% of your net profits. Drop your win rate by just 5% (to 55%), and your mathematical expectancy plummets below zero:
- Wins: 5.5 trades × $70 profit = +$385
- Losses: 4.5 trades × $100 loss = -$450
- Net Loss: -$65
This asymmetrical risk profile is why most retail traders fail. The house takes a commission on every single win by underpaying your risk, while taking 100% of your stake when you lose.
Step-by-Step: How to Calculate Your True Mathematical Edge
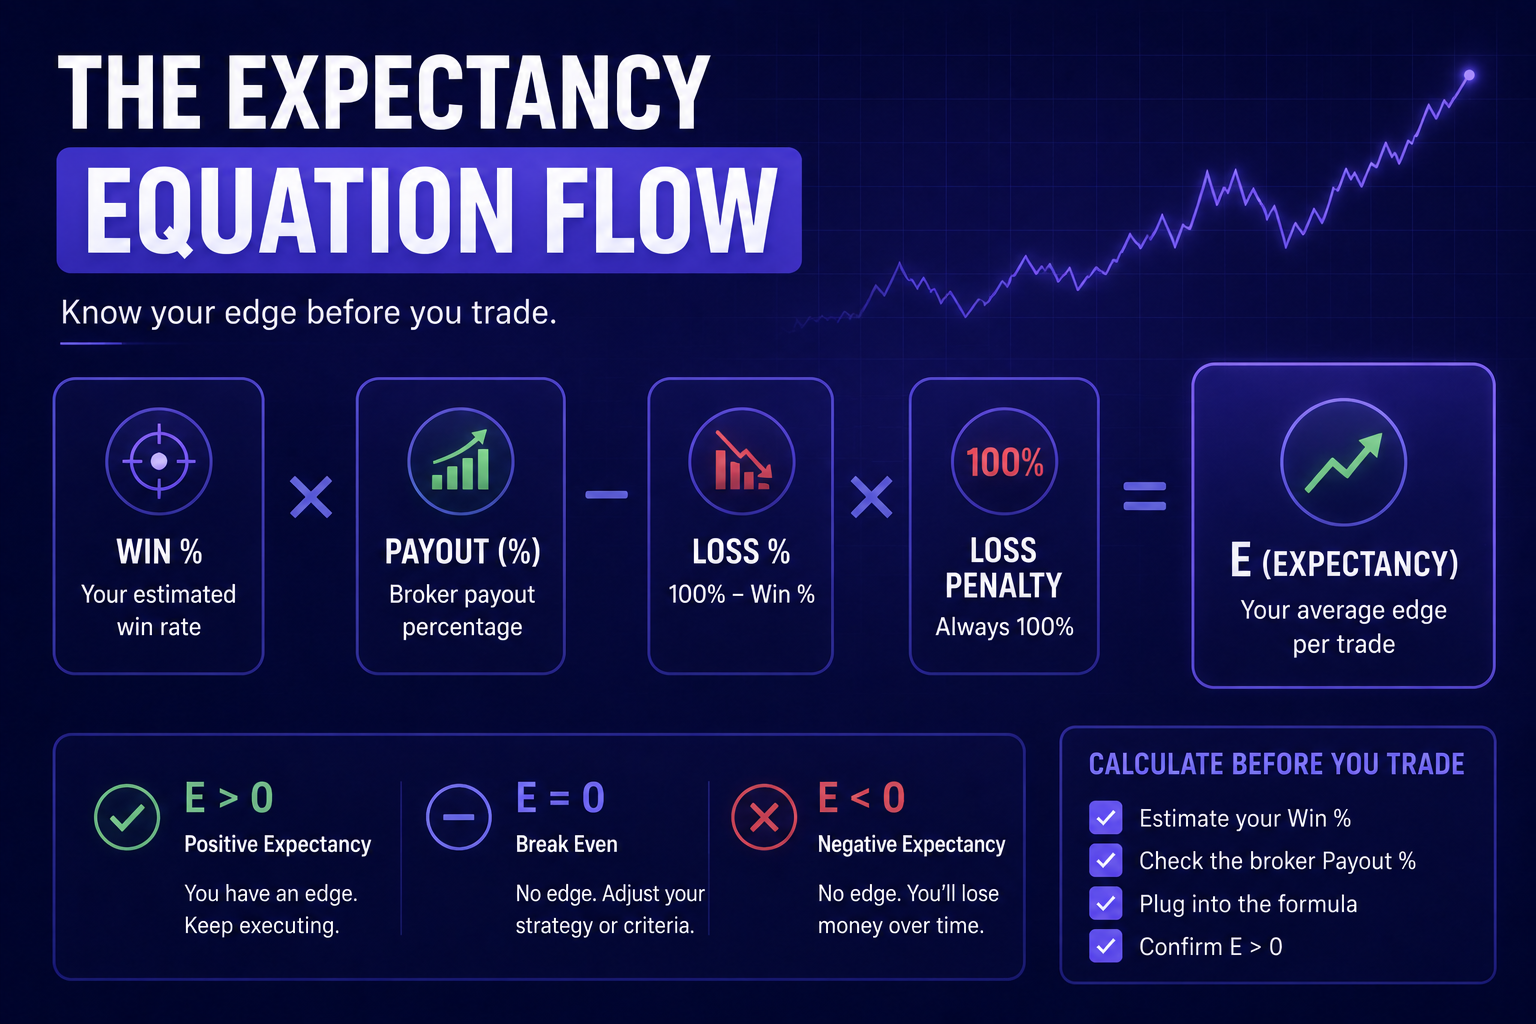
To determine whether your strategy has a genuine statistical advantage, you must calculate your Expected Value (EV) per trade.
The formula for Expected Value in day trading is:
EV=(WP)-(L1)
Where:
- W = Probability of winning (your true historical Win Rate expressed as a decimal)
- P = Broker payout rate expressed as a decimal (e.g., 80% = 0.80)
- L = Probability of losing (1-W)
Let’s run two real-world scenarios to see how this works in practice.
Scenario A: The High-Frequency Scalper- Win Rate (W): 62% (0.62)
- Broker Payout (P): 75% (0.75)
- Loss Rate (L): 38% (0.38)
- Calculation: EV=(0.620.75)-(0.381)=0.465-0.38=+0.085
For every $1.00 you risk, your positive mathematical edge is 8.5 cents. This strategy is sustainable over time.
Scenario B: The Over-Traded Session- Win Rate (W): 56% (0.56)
- Broker Payout (P): 70% (0.70)
- Loss Rate (L): 44% (0.44)
- Calculation: EV=(0.560.70)-(0.441)=0.392-0.44=-0.048
For every $1.00 you risk, you lose 4.8 cents. Even with a winning majority of trades (56%), the mathematics guarantee account depletion over a large sample size.
Finding the Right Trading Environment
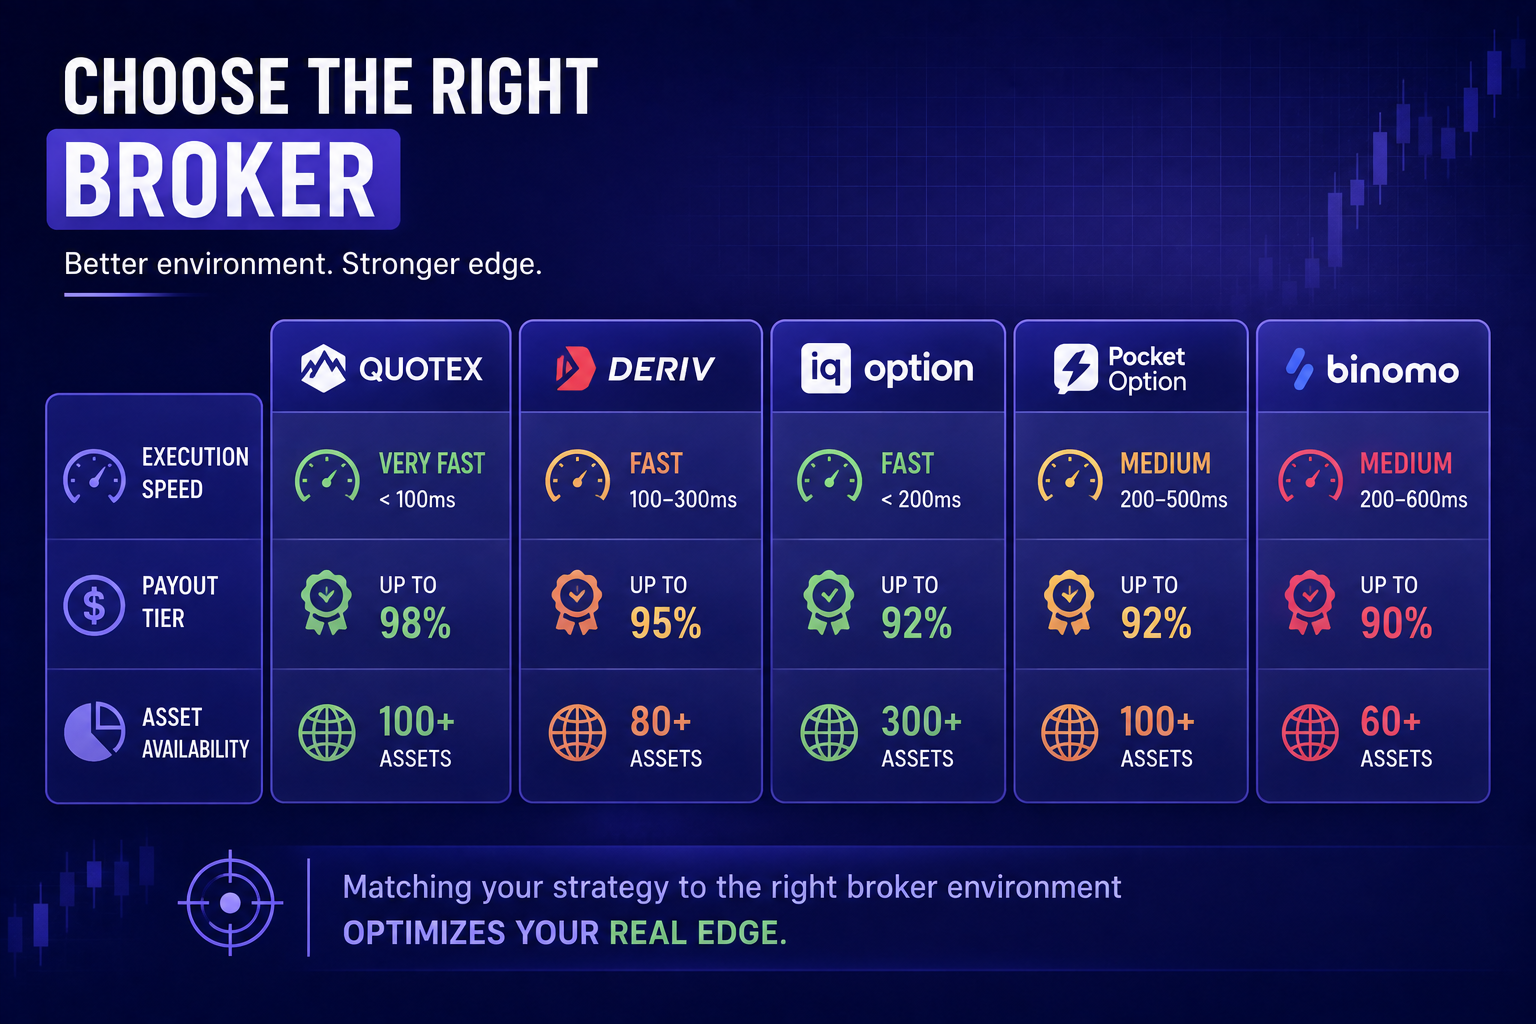
Once you master the math, your execution environment becomes critical. Different brokers cater to different market conditions, expiry times, and liquidity profiles. Testing your EV across multiple reliable platforms allows you to route trades where payouts are highest for specific asset pairs.
Many traders spread their execution across reputable platforms like Pocket Option or test specialized charting interfaces on Quotex. If you prefer fast execution times for short-term impulse setups, platforms such as ExpertOption and Olymp Trade offer dedicated mobile trading interfaces.
For broader asset coverage, including traditional Forex pairs, commodities, and index options, exploring platforms like Deriv or Capital Core can help you find higher baseline payouts during peak trading hours.
Higher payouts lower your break-even threshold, directly expanding your EV.
Moving Beyond Simple Indicators: The Data Edge
Calculating your expected value is only half the battle. The real difficulty lies in keeping your win rate (W) consistently above the break-even threshold.
When I started out, I relied on simple technical indicators—RSI oversold bounces, MACD crossovers, and basic support levels. But simple indicators are available to everyone, which means they rarely deliver a lasting edge on their own.
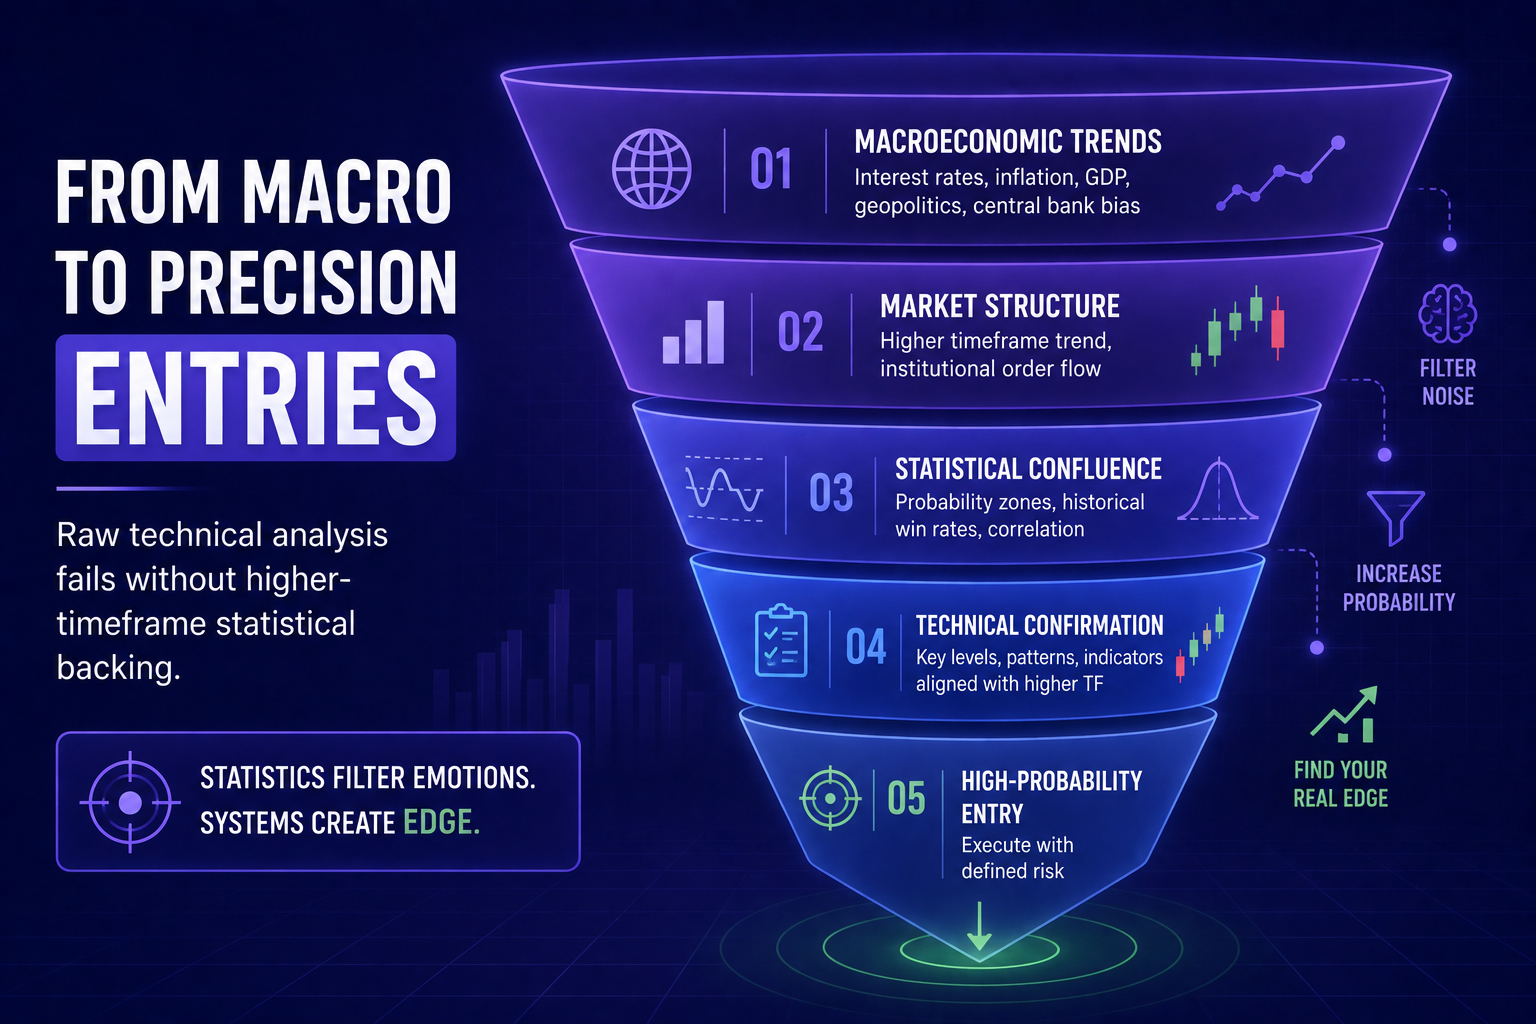
Market dynamics change rapidly. Volatility shifts, institutional order flow changes, and macroeconomic releases wipe out technical setups in seconds. Real consistency requires tracking institutional sentiment, macroeconomic trends, and algorithmic price structures.
Instead of guessing where price will move next based on a single 5-minute chart, professional traders look at comprehensive data feeds, multi-timeframe forecasts, and market sentiment metrics.
Stop Trading Blind: Elevate Your Analytical Advantage
If you are tired of guessing outcomes and relying on luck, it is time to upgrade your entire trading framework.
To trade options with mathematical discipline, you need deep market insights, real-time technical assessments, and verified forecasting setups. You can access professional market analyses, technical frameworks, and predictive intelligence right now at the BeCoin Forecast Hub.
If you want to step up to professional trading, unlock institutional-grade market updates, real-time trading signals, and deep-dive technical forecasts by upgrading to BeCoin Premium. Stop fighting unfair payout math alone—join BeCoin Premium today and start trading with a verified statistical advantage.
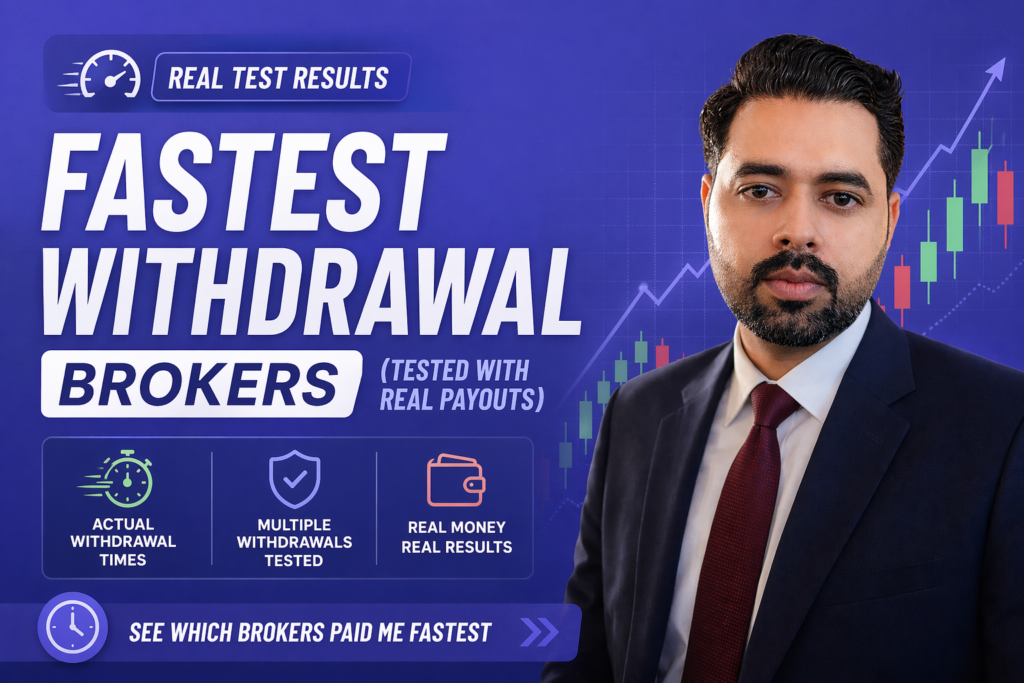
Fastest Withdrawal Brokers (Real Test Results)
The first time I made a profitable trade, I wasn’t thinking about strategy anymore. I was thinking about one thing. Can I actually withdraw this? I requested my payout and waited. And waited. That “processing” label stayed there longer than my trade itself. That moment changed how I evaluate brokers. Since then, I’ve made it […]
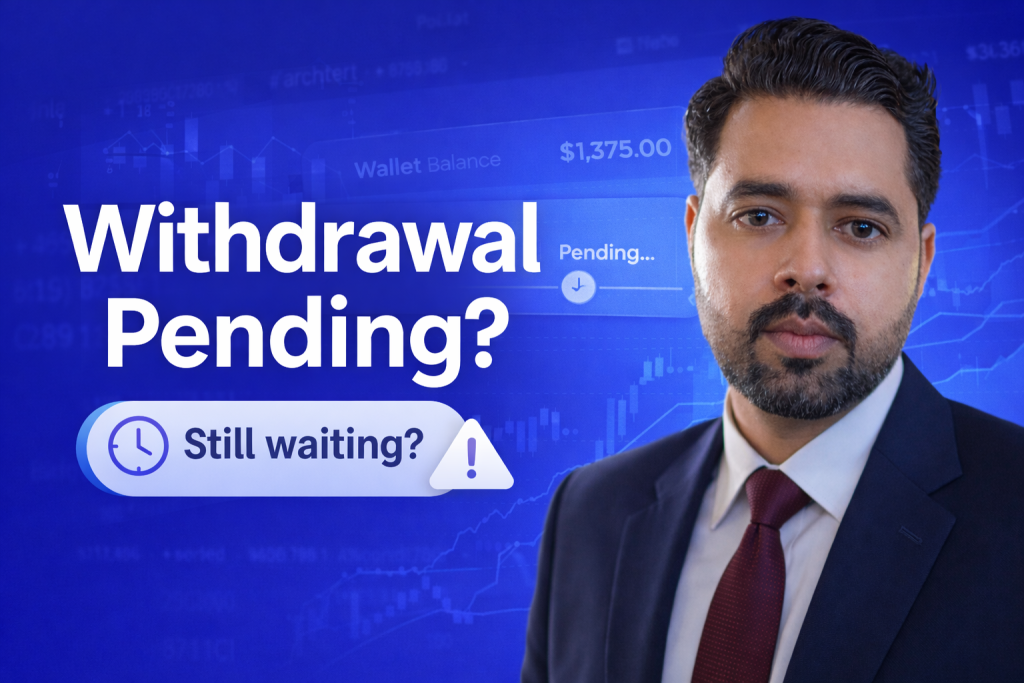
Binomo Withdrawal Pending: Real Reasons, Timelines, and What to Do at Each Hour Mark
The first time I saw Binomo withdrawal pending on my screen, I stopped caring about my trades for the day. Not because the amount was huge. It wasn’t. What bothered me was the uncertainty. When you trade on a platform like Binomo, the real test isn’t the deposit button. It’s the withdrawal button. Depositing is […]

Capital Core for US Traders: Can Americans Use It Safely?
I’ll be honest: when I first started digging into Capital Core for US traders, I wasn’t looking for hype. I was looking for a boring answer. Can I sign up from the US?Can I actually trade?And the real question nobody asks loudly enough: if I win, can I withdraw without drama? That last one matters […]

The Clock and the Candle: How I Stopped Guessing the Best Time to Trade Day Trading
I still remember the night I blew my third trading account. It was 11:30 PM. The house was completely quiet, the market charts on my screen were barely crawling, and I was forcing trades out of pure impatience. I kept staring at a flatline asset, placing one-minute positions, convinced that the market owed me a […]

The Day I Lost My First Ten Dollars: My Hunt for the Best Mobile Trading App for Beginners
I still remember the exact shape of the cloud outside my window when my first live trade ended in the red. It was a crisp morning, and I was sitting on my couch with a lukewarm cup of coffee, staring at a flashing line on my smartphone screen. I had just deposited ten bucks, convinced […]