
How to Audit 100 Trades and Find Weaknesses in Trading
⚠️ Quick Reality Check for Day Traders:
If your account is shrinking despite following a strategy, guessing won't fix it. Stop changing indicators every week. You don't need a new strategy! you need an honest trade audit to spot where you are losing money.
I used to spend hours analyzing technical charts, but my account balance was going nowhere. Every time I had a winning week, a few bad trades wiped out my progress. I blamed bad market luck until I logged 100 trades into a tracking sheet.
The numbers revealed a painful truth: I wasn't losing money because of bad setups; I was losing money because I traded during off-hours and cut my winning trades short.
When your trading performance stalls, relying on emotion or guesswork only leads to more losses. Instead, you need objective data.
Before opening your next position, check our Becoin Home Page. Our automated tools process over 300 market signals in real time to deliver clear, data-backed setups ,helping you stay objective. If you want structured risk parameters and institutional-grade setups, explore our Becoin Premium Plans to trade with a statistical edge.
Why 100 Trades Is the Magic Baseline
Evaluating performance over 5 or 10 trades gives you misleading information. A lucky 5-trade winning streak can make a bad plan look great, while a minor loss streak can make a winning system look broken.
A study on machine learning in financial forecasting published in IEEE Xplore demonstrates that automated, multi-signal algorithms significantly reduce execution errors and emotional bias compared to manual trader decision-making.
Logging 100 trades provides three key advantages:
- Statistical Significance: It smooths out short-term noise to reveal your true win rate.
- Exposes Bad Habits: Repeated mistakes ,like moving stop-losses or revenge trading, become obvious.
- Spans Different Markets: It tests your strategy across trending, ranging, and high-volatility conditions.
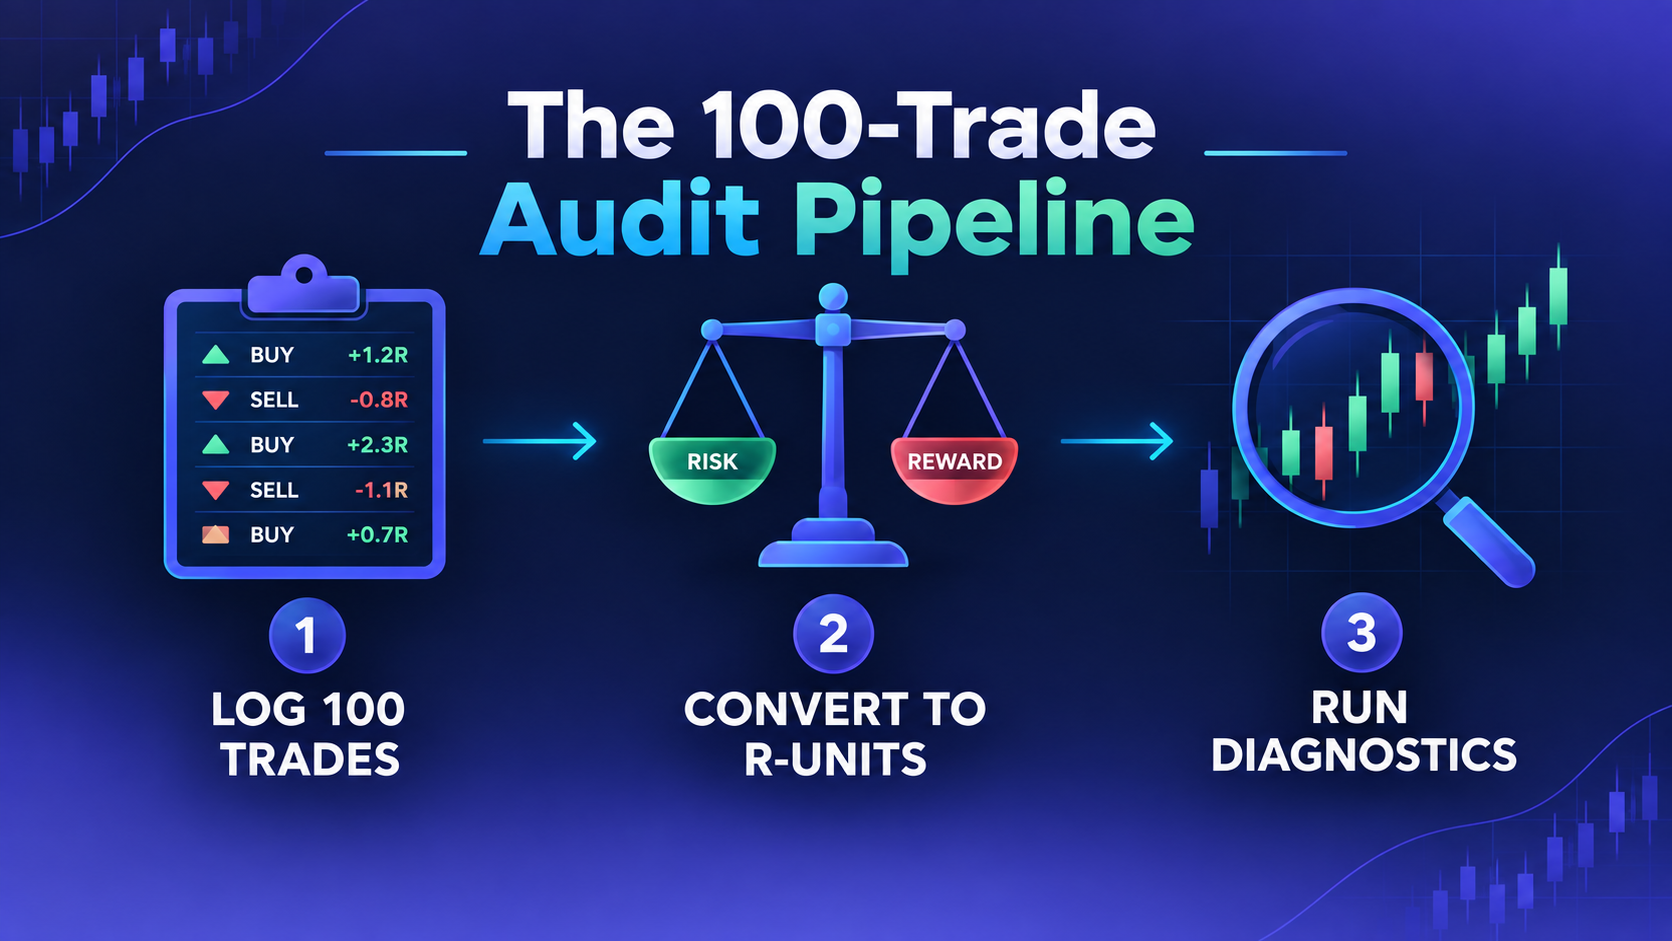
Step 1: Gather Your Audit Data Log
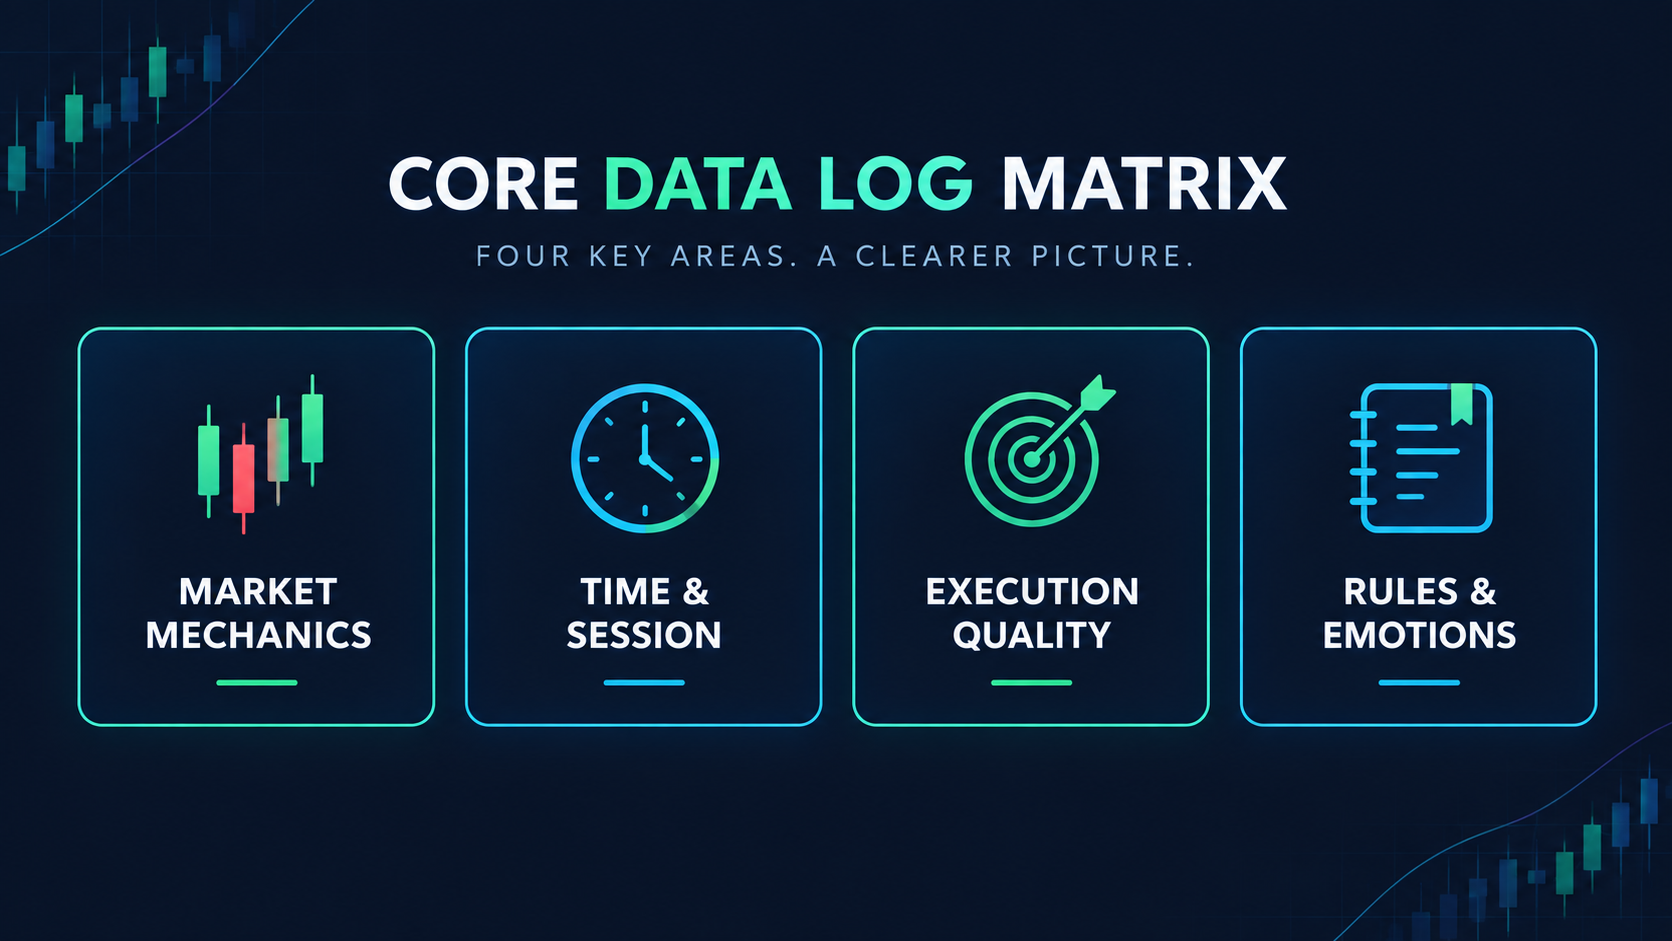
Standard broker statements show your net profit and loss, but they miss crucial context. Export your trading history into a custom sheet and track these core columns:
| Data Category | Key Parameters to Record |
|---|---|
| Market Mechanics | Asset Name, Trade Direction (Long/Short), Leverage, Position Size |
| Time & Session | Entry/Exit Timestamps, Trading Session (Asian, London, NY) |
| Execution Quality | Planned Risk-to-Reward (R:R) vs. Realized R:R |
| Rules & State | Strategy Setup Name, Rule Adherence (Yes/No), Emotional State |
Step 2: Convert Dollars to "R-Multiples"
To remove emotional bias, stop viewing trade outcomes in dollars and cents. Convert every outcome into R-multiples, where 1R equals your initial planned risk.
- If you risk $50 to make $150 and win, the trade is +3R.
- If you risk $50 and hit your stop-loss, the trade is -1R.
Viewing performance through R-multiples helps you evaluate execution discipline rather than dollar fluctuations.
Step 3: Run the 3-Step Weakness Diagnostic
Once your 100 trades are logged, run these three diagnostic checks to pinpoint account leaks:
Diagnostic 1: Performance by Trading Session
Group your trades by market hours. Many traders discover they are profitable during high-volume periods (like London or New York sessions) but bleed capital during slow off-hours (like the Asian session).
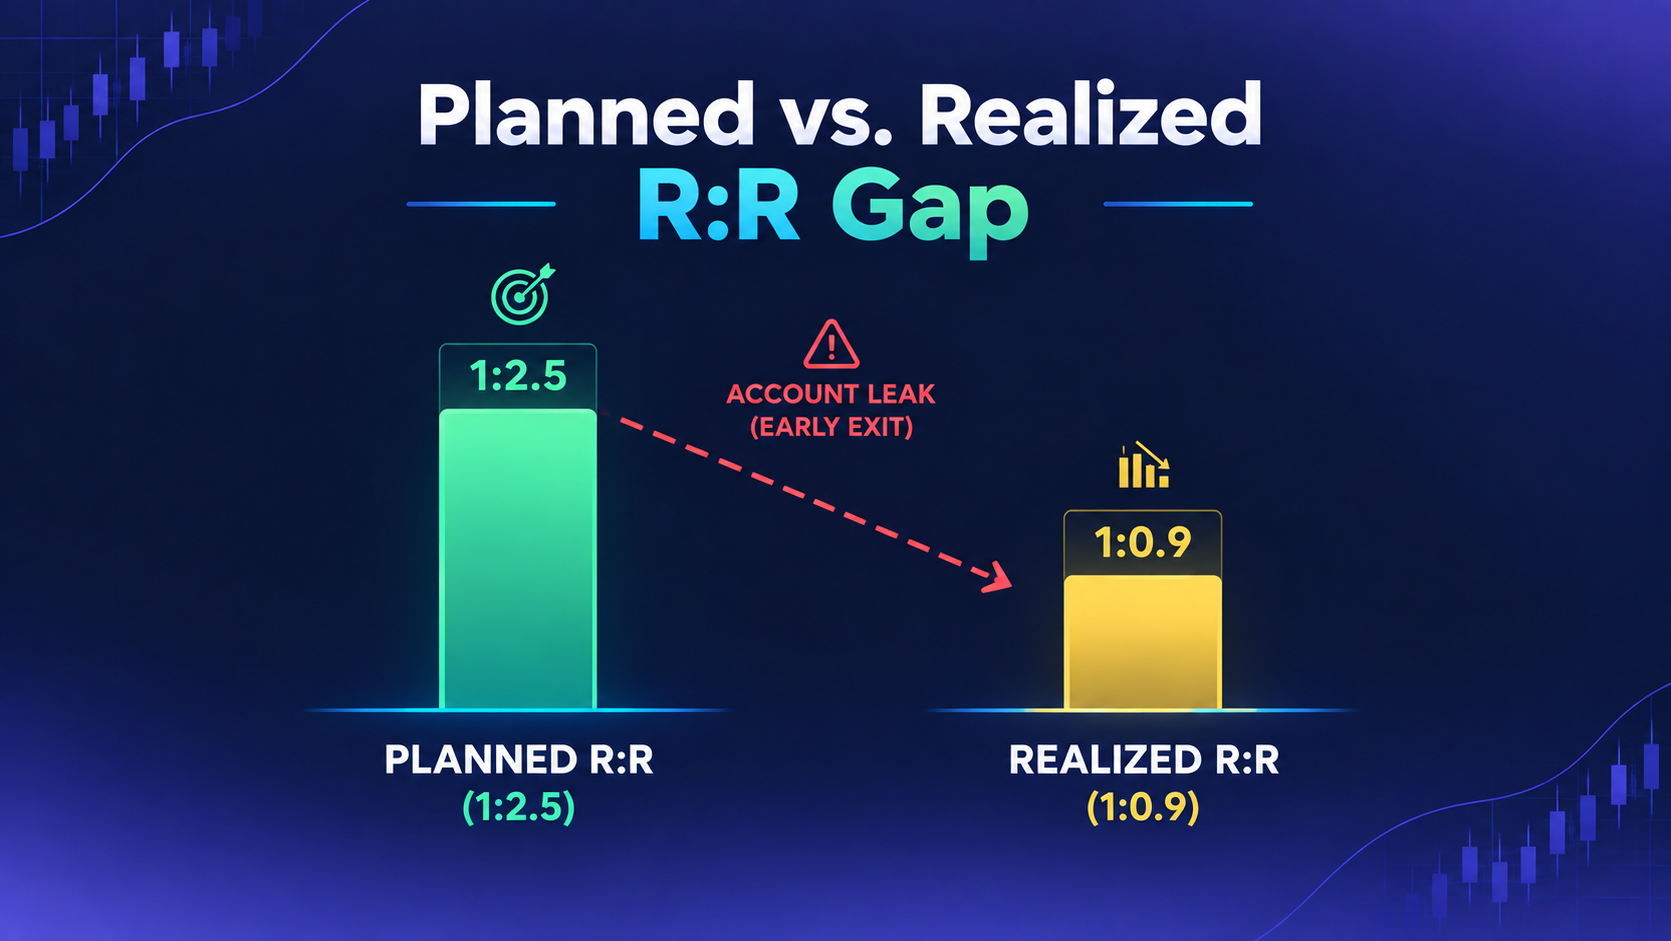
Diagnostic 2: Planned R:R vs. Realized R:R
Compare what your setup promised versus what you actually secured.
- Planned R:R: 1:2.5
- Realized R:R: 1:0.9
If your realized R:R is far lower than planned, you are likely moving target orders early out of fear or letting losing trades run past your stop-loss.
Diagnostic 3: The "Rule Breach" Tax
Filter your log by trades where you broke your strategy rules. Calculate your total R-multiple loss on those specific trades. Most traders realize that their strategy is actually profitable, all their net losses came directly from undisciplined entries.
Step 4: Turn Insights into Hard Execution Rules
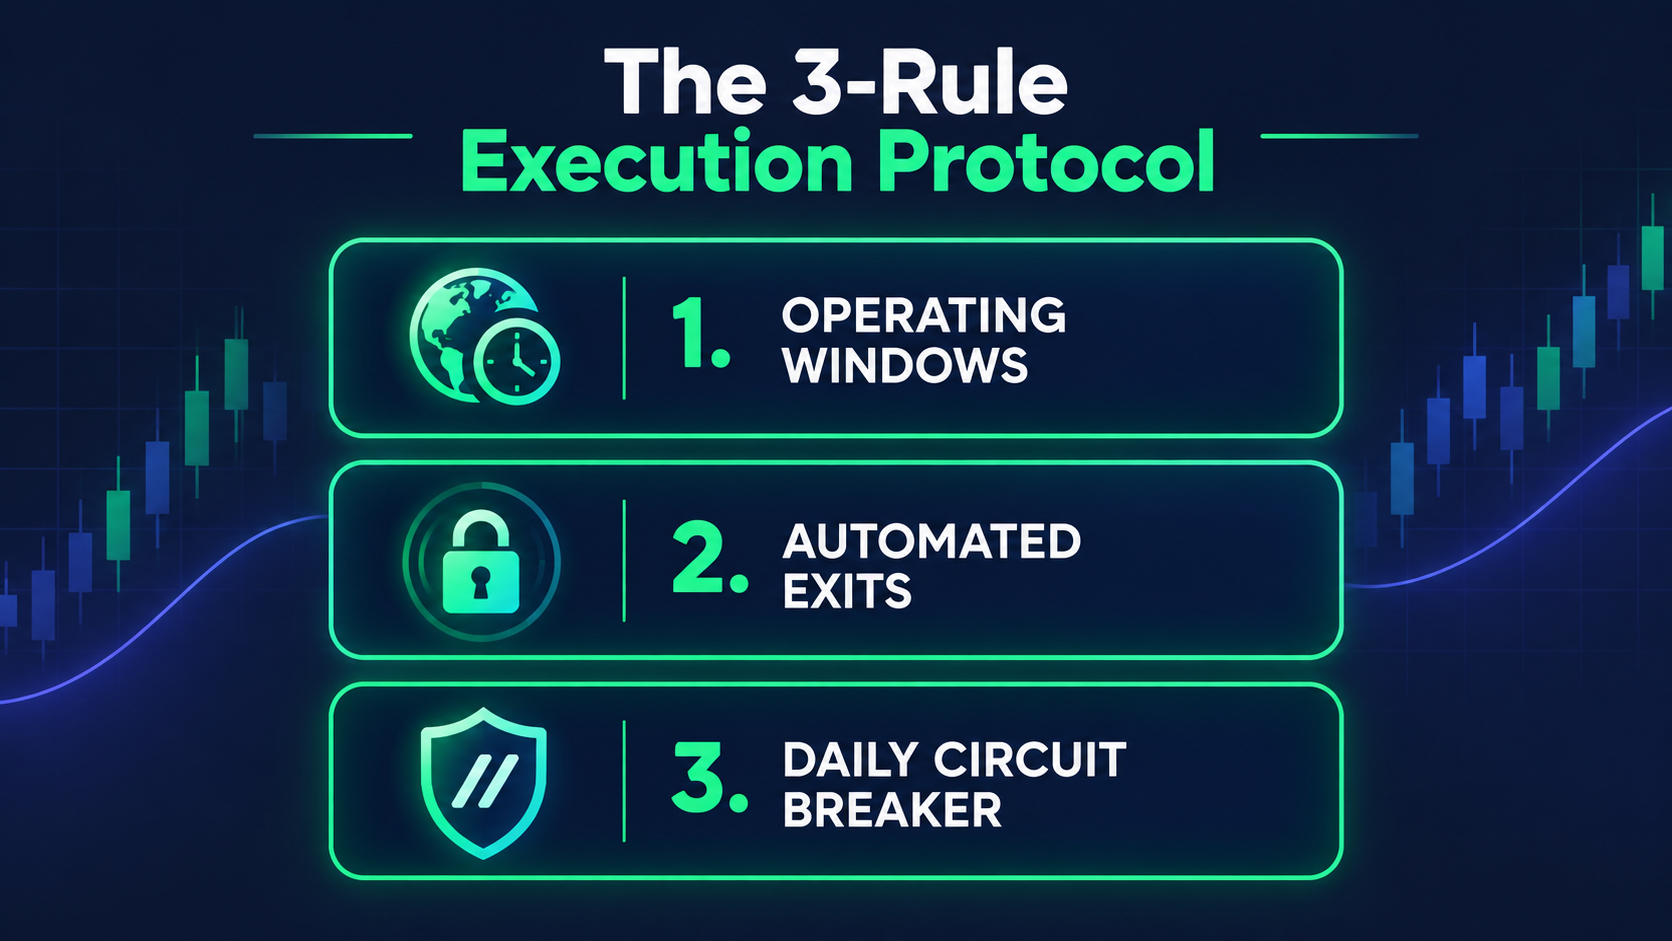
An audit is useless if you don't change your behavior. Use your diagnostic data to write three non-negotiable rules:
- Restrict Operating Windows: Only trade during sessions where your data proves an edge. Ban off-hours trading entirely.
- Automate Trade Exits: Set your stop-loss and take-profit targets immediately. Never adjust them manually mid-trade.
- Set a Daily Circuit Breaker: If you lose 2 consecutive trades, close your trading terminal for the day to prevent revenge trading.
To see how emotional management protects your capital during audits, read our guide on Why Revenge Trading Feels So Tempting (And How to Stop It).
Ready to Build a Consistent Trading System?
Auditing your trade history removes guesswork and reveals your real operational edge.
- Access Objective Signals: Stop entering impulse trades. Analyze technical setups across Crypto, Forex, and Stocks using the Becoin Forecast Hub.
- Master Your Daily Process: Pair your audit findings with a structured execution plan. Check our walkthrough on the Simple Daily Trading Routine for Consistency.
- Calculate Position Size & Risk: Use our free Position Size Calculator to keep your account risk locked at 1% per trade.
- Upgrade to Institutional Parameters: Ready to execute with clear targets and statistical backing? Join Becoin Premium Plans today.

Simple Daily Trading Routine for Consistency
Most traders do not fail because of strategy alone. They fail because they are random. They trade when emotional, skip planning, increase risk after losses, and ignore review sessions. Consistency in trading usually comes from routine more than prediction. A simple daily trading routine helps you stay disciplined, reduce emotional mistakes, and improve decision making […]

Biggest Beginner Mistakes That Kill Trading Accounts
Trading looks simple from the outside. Open an account, place a few trades, and grow your balance. But reality is different. Most beginners do not lose because markets are impossible. They lose because they repeat the same avoidable mistakes. A small account can survive bad market conditions. What usually kills it is poor decision-making, emotional […]

Safest Trading Platforms (Risk Breakdown) – Real Comparison for 2026
Choosing a trading platform isn’t about features — it’s about avoiding hidden risk. Most traders compare brokers like Quotex vs Pocket Option vs Deriv vs Olymp Trade expecting a clear winner. Instead, they find conflicting reviews, promotional claims, and no real explanation of how these platforms behave when money is on the line. The real […]

Deriv vs IQ Option for Beginners in 2026: Which Platform Is Better to Start With?
Choosing your first trading platform can decide whether you stay consistent or quit after blowing your first account. Most beginners do not fail because trading is impossible. They fail because they start on platforms that confuse them, encourage emotional trading, or make risk management difficult. Two names that often appear in beginner discussions are Deriv […]

Which Is Easier for Beginners: Binomo or IQ Option?
For most beginners, the hardest part of trading is not strategy. It is surviving the first few months without blowing the account from emotional decisions, overtrading, and poor risk management. That is why choosing the right platform matters more than many new traders realize. Two names dominate beginner conversations in binary and short-term trading: Binomo […]
Binomo Deposit/Withdrawal: Why Using Different Payment Methods Causes Delays
The first time I hit a decent withdrawal on Binomo, I thought the hard part was over. I had done the trades. I had managed the risk better than usual. I had finally resisted the urge to overtrade after a win streak. So when I clicked withdraw, I expected the money to move as smoothly […]