Gold Forecast: XAU/USD at 4,471 Holds 4,461 Average
- Gold trades at $4,471.88, unchanged on the day, recovering toward 4,500 after a slide to 4,310.
- Roughly two-thirds odds are priced for a September Federal Reserve increase, with ten-year yields above 4.8%.
- The 4,461 average is the level that decides whether the recovery extends.
Fundamental Analysis: Gold (XAU/USD)
The rate repricing is the dominant force and it is working against the metal. The Federal Reserve has held its target at 3.50%-3.75% for five consecutive meetings, but three members dissented in July in favour of a 25 basis point increase and markets now price roughly a two-thirds probability of a hike at the September meeting. Ten-year Treasury yields above 4.8% are the transmission channel: every basis point of real yield raises the cost of holding a non-yielding asset, which is why gold fell from near 4,690 to 4,310 in under three weeks.
The counterweight is that the reason for the hawkishness is itself supportive. Policy is tightening because inflation risk has re-emerged, and the specific source is energy — crude above $91 following the disruption to Gulf export flows, with central banks from Sydney to London naming it explicitly in their guidance. An inflation shock that forces central banks to tighten is ambiguous for gold in a way that a growth-driven tightening is not, because the same shock strengthens the long-term case for holding it.
That tension explains the shape of the recovery from 4,310. The buying has been persistent enough to retrace a meaningful share of the decline but not decisive enough to reclaim 4,500, which is what a market genuinely torn between two arguments looks like. The September decision is the resolution point: a hike is largely priced in already, but the guidance that accompanies it will settle which of these two forces the market chooses to weight.
Technical Analysis: Gold (XAU/USD)
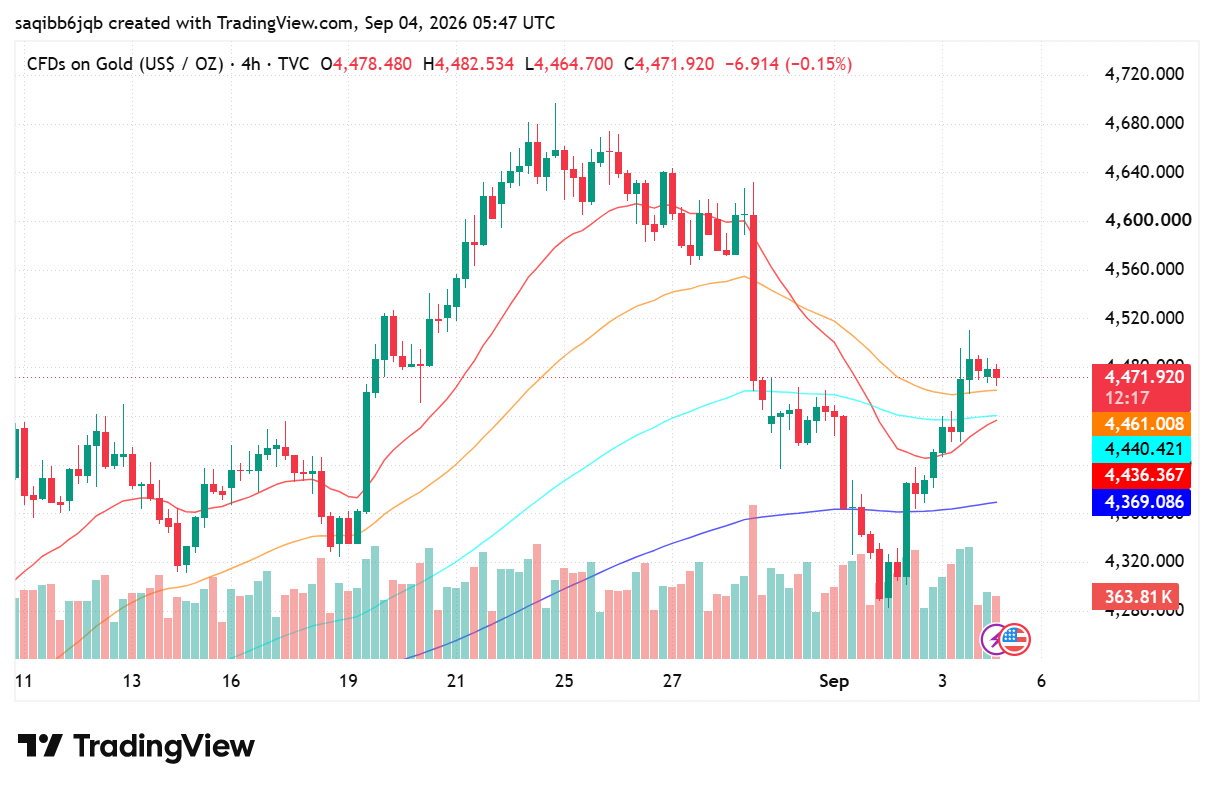
The 4-hour chart shows a sharp decline that has stabilised into a recovery. Price rolled over from roughly 4,690 in mid-August, broke down through the full moving average band in a single session, and bottomed at 4,310 before turning higher. The averages have since converged into a tight cluster at 4,461.00, 4,440.42 and 4,436.36, with the slower 4,369.09 line beneath, and price is now trading just above that cluster rather than below it.
Resistance is the 4,500 area where the recovery has stalled, then 4,520 and the 4,560 shelf above. Support is the 4,461.00-4,436.36 average cluster directly beneath spot, then 4,369.09, with the 4,310 swing low below. A 4-hour close under 4,436.36 would put price back inside the decline and invalidate the recovery read.
Rolling level updates for this and the other majors are tracked in the Market Forecast Hub.

EUR/USD holds 1.1414 before the ECB decision: three scenarios
EUR/USD traded near 1.1414 before the ECB’s July decision. Here is what a hold, hawkish hold or surprise hike could mean for 1.1350 and 1.1480.

Trading Currency Strength Instead of Single Pairs
It was a Tuesday afternoon when I realized I was fighting a losing battle against a ghost. My screen was a chaotic web of indicators. I had the EUR/USD chart open, a moving average crossing over here, a relative strength index flashing oversold there, and a price action setup that looked textbook perfect. I clicked […]

Which Broker Has Better Risk Management Tools?
The burning smell of my own account blowing up is a scent I will never forget. It was a rainy Tuesday afternoon a few years back. I sat huddled over my laptop, watching a currency pair oscillate. Confident, arrogant, and entirely unprotected, I clicked buy. Minutes later, a sudden market spike completely wiped out my […]

Safest Broker for Small Deposits in 2026
Looking for the safest broker for small deposits in 2026? Discover beginner-friendly trading platforms with low minimum deposits, reliable withdrawals, risk controls, and the best options for starting safely with limited capital. Starting trading with a small amount of money sounds easy until you actually deposit real funds. Most beginners quickly realize that choosing the […]

Binomo Minimum Deposit vs Minimum Withdrawal: The Real Trap Beginners Miss
I almost fell for the simplest trap on Binomo. Not a bad entry.Not a losing strategy.Not even a bad signal. It was the gap between the Binomo minimum deposit vs minimum withdrawal that quietly changes how beginners behave. When I first opened a real account, the low entry point looked harmless. That’s exactly why it […]

Is Capital Core Safe or a Scam? What Day Traders Should Know Before Depositing
I’ll be honest: the first time I landed on Capital Core, I didn’t feel excited. I felt suspicious. That might sound strange coming from someone who has spent years around day trading and offshore brokers, but if you’ve traded long enough, you know the pattern. A polished homepage. Big payout claims. A low minimum deposit. […]