GitLab Extends Its Run but Momentum Is Stretched
Where the stock stands
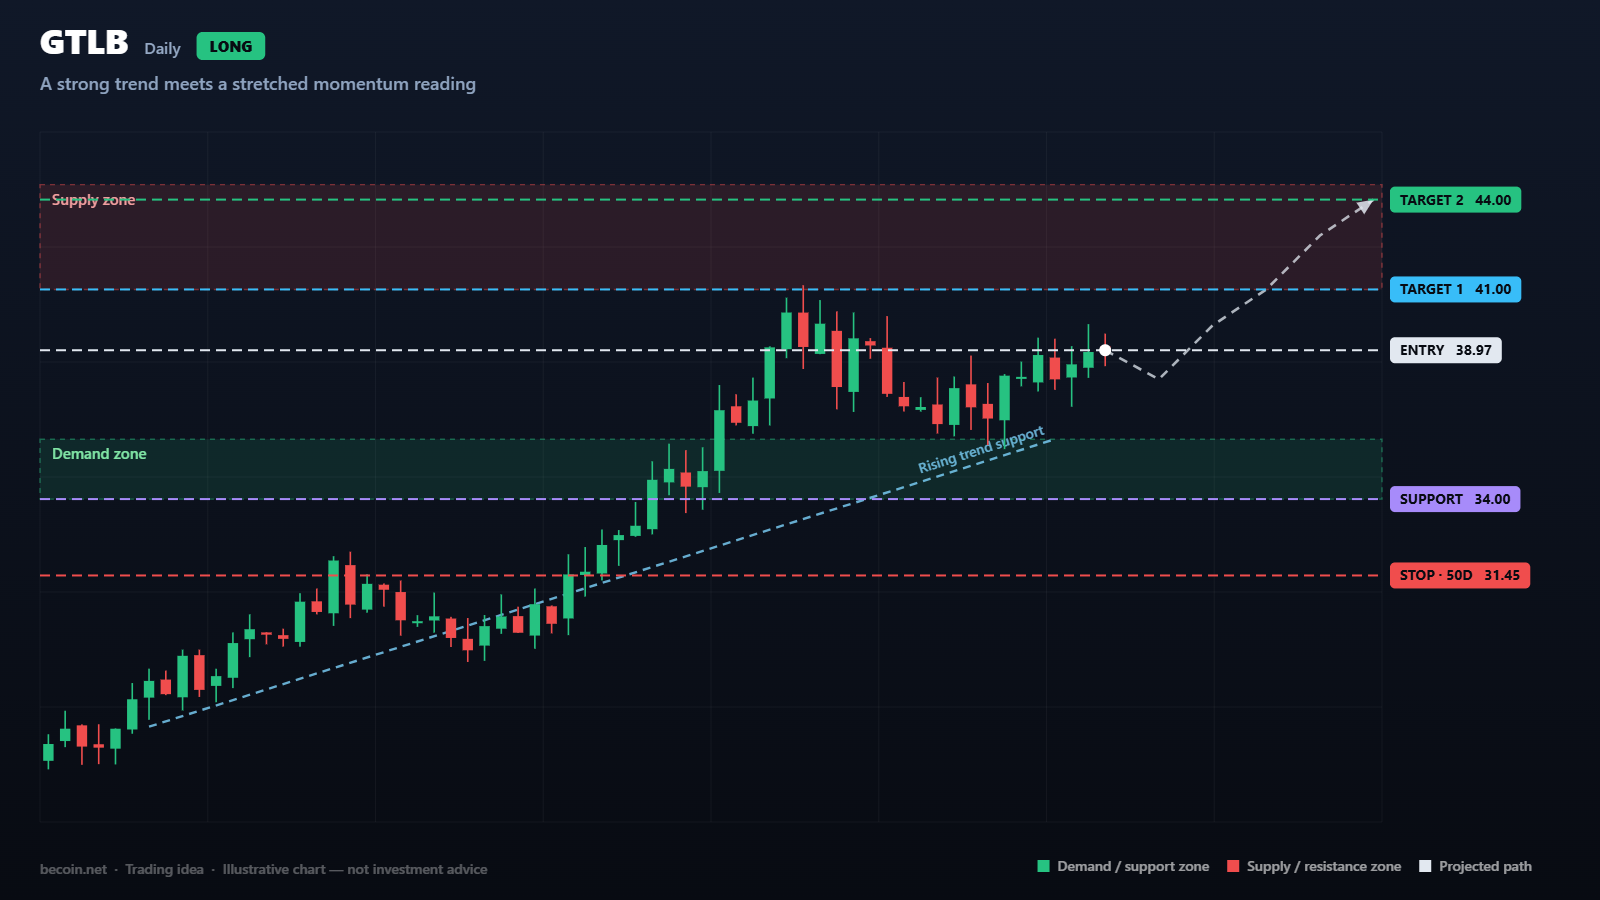
GitLab is trading near 38.97 after a powerful run from the 18.73 low. Price sits well above both the 50-day average at 31.45 and the 200-day at 31.92, and those two averages have converged and turned higher. That is a constructive structure by any reasonable measure, and the trend is clearly up.
The complication is the daily RSI at 71. Momentum readings above 70 are not a sell signal on their own, and strong trends can hold them for weeks. What they do reliably indicate is that the easy part of the move has already happened and that new entries are being made at prices where the risk-to-reward ratio has deteriorated.
What the chart is showing
The advance has been orderly rather than parabolic. A rising line drawn across the higher lows since the base now runs close to 36, and price has pulled back to it more than once without breaking. Each of those pullbacks has been shallow, which is characteristic of a market where buyers are impatient and unwilling to wait for better prices.
Overhead, the 41 to 44.50 area is the first real supply zone, and the 52-week high at 52.38 sits well above that. There is comparatively little historical structure between here and 44, which cuts both ways: it can allow a fast move higher, and it offers little support if sentiment turns.
Levels that matter
Support is 34 to 36 first, where the trendline sits, then 31.45 at the converged moving averages. That second area is the one that decides whether this is a pullback or a reversal.
Resistance is 41, then 44.50. Beyond that, 52.38 is the 12-month high and the natural longer-term objective if the trend continues.
How the idea could play out
The trend-following case is simply that support holds and price grinds toward 41 and then 44.50. From current levels with a stop below 31.45, the risk is about 7.50 dollars against a first target of 41, which is only 0.3 times risk. That is a poor trade, and no amount of enthusiasm about the trend changes the arithmetic.
A pullback into the 34 to 36 zone would change the picture completely. The same targets measured from 35 with a stop at 31.45 produce roughly 1.7 times risk at 41 and 2.7 times at 44.50. That is the trade worth waiting for.
What would invalidate it
A daily close below 31.45 would put price back under both moving averages and end the trend argument. Short of that, a failure at 41 that produces a lower high would suggest the move is transitioning from trend to range, which calls for a different approach entirely.
Managing the position
Software companies at this size are heavily driven by quarterly results and guidance, and a stock that has already run 100 percent carries elevated expectations into every report. Holding through earnings after a move like this is a decision to accept a large, unpredictable outcome. Reducing size beforehand is the more disciplined route.
For anyone already positioned, trailing a stop beneath the rising trendline captures most of the move while ensuring a reversal does not give back everything.
The bottom line
The trend in GitLab is healthy and the structure is clean. The only problem is price. Buying an extended stock at a stretched momentum reading is how good theses turn into bad trades, and the chart offers a specific, identifiable area lower where the same idea becomes worth acting on.
Becoin.net Premium Forecast - Becoin.net Tariff Plan
This analysis is a technical study prepared for educational purposes. It is not investment advice, and no outcome described here is guaranteed. Trade only with capital you can afford to lose.

How Liquidity Affects Day Trading Results
When I first started trading day trading, I believed success was all about finding the perfect indicator. I spent weeks testing moving averages, RSI settings, support and resistance levels, and dozens of YouTube strategies that promised easy wins. Some worked for a few trades, but most failed. What confused me was that the same setup […]

Bitcoin slips to $65,741 as oil and yields test the breakout
Bitcoin is near $65,741 as rising oil and Treasury yields test the $65.7K breakout floor. Here are the levels that confirm or invalidate the move.

Finding My Perfect Workspace: The Search for the Best Broker for My Daily Trading Routine
The alarm goes off at 6:00 AM. By 6:30 AM, I am sitting in front of my monitors with a steaming mug of black coffee. The house is completely quiet, the market is preparing its next major move, and my charts are completely bare. This is my daily sanctuary. For a long time, this morning […]

WTI reaches $89.43 as Brent clears $95 on renewed supply risk
WTI traded near $89.43 while Brent moved above $95 as Middle East shipping risk lifted crude for a fifth session. Key levels, catalysts and invalidation.

Best Broker for Learning Price Action in 2026 (Tested by Real Traders)
Most traders think they need a better strategy. What they actually need is a better understanding of price. A few years ago, one of our community members had over ten indicators on his chart. RSI. MACD. Moving averages. Bollinger Bands. Stochastic. Every new YouTube video added another indicator. The result? More confusion. Not more profits. […]

Why Traders Move from Binomo to Deriv in 2026: The Real Reasons Behind the Switch
If you spend enough time around trading communities, you’ll notice a pattern. Many traders start with Binomo. Then, after a few months, a surprising number begin looking at Deriv. Some switch completely. Others keep both accounts but gradually move most of their trading activity to Deriv. I noticed this trend while talking to beginner traders […]