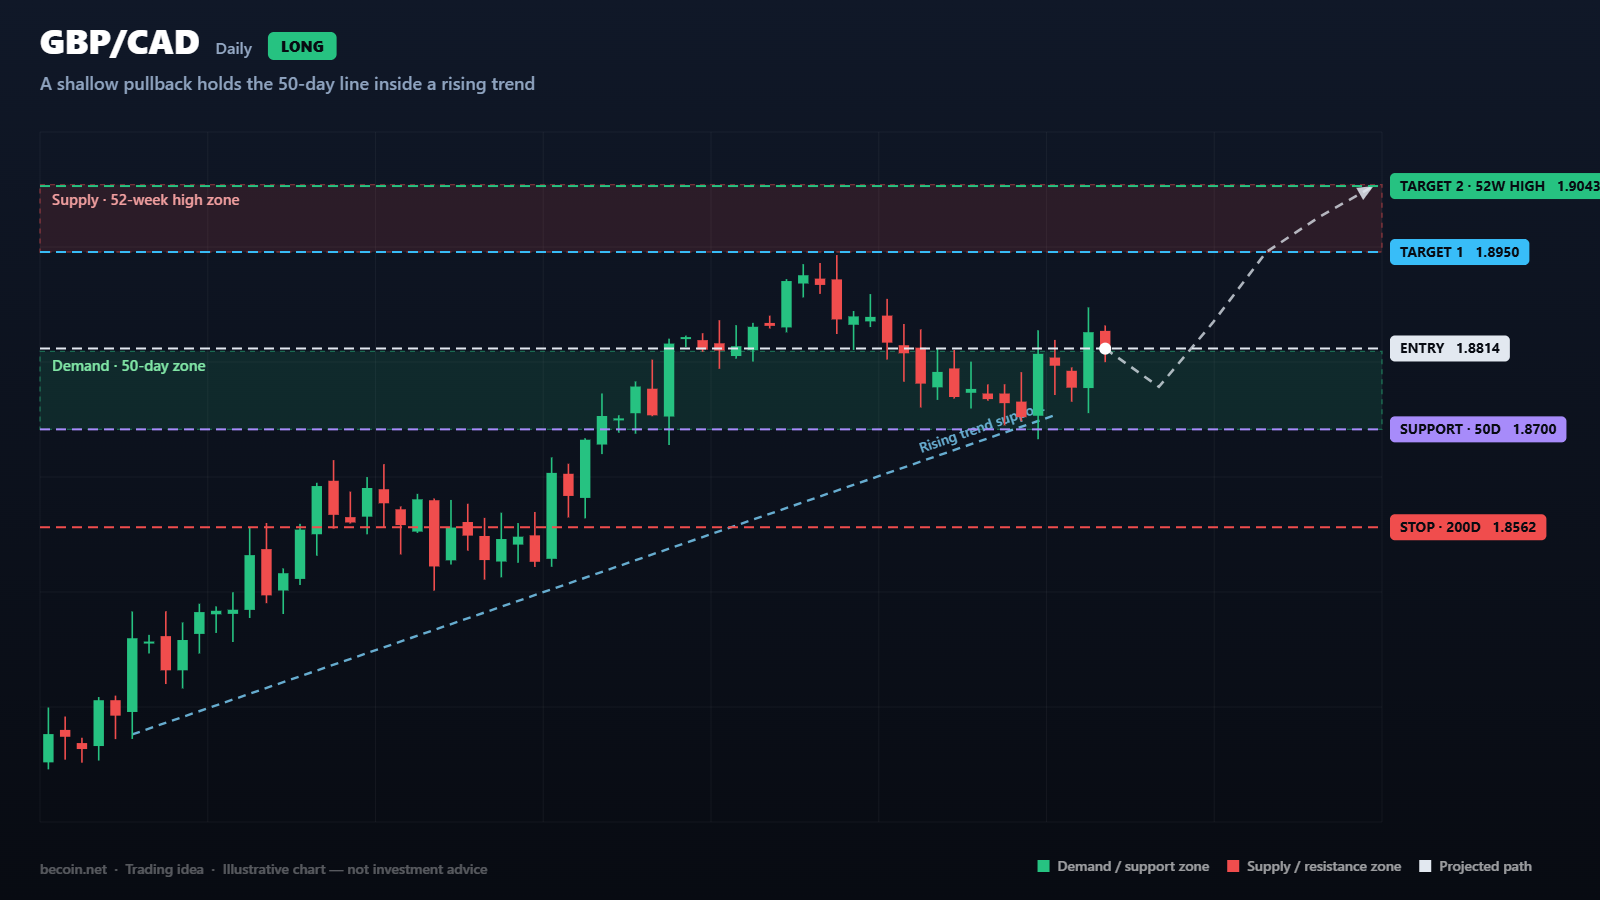
GBPCAD Builds a Base Above Its 50 Day Line
Where the pair stands
GBP/CAD is trading near 1.8814 after spending most of the past year climbing from roughly 1.8020 to a high just above 1.9043. The recent stall has taken price back to the 50-day average at 1.8803, which is the first time in weeks that the pair has needed that support at all. The 200-day average sits far below at 1.8562, so the larger trend has not been threatened in any meaningful way.
Momentum has cooled to a neutral reading, with the daily RSI hovering near 48. In an uptrend, a neutral momentum reading during a sideways pause is usually a healthy sign rather than a warning. It means the market has worked off its overbought condition through time rather than through a sharp decline.
What the chart is showing
The advance has followed a rising line drawn across the swing lows since the base formed in the low 1.82s. Price has touched that line several times and each touch has produced a bounce. It now runs close to 1.8720, which sits just under the current market and just under the 50-day average.
Above the market, the 1.8950 to 1.9045 area has capped two separate attempts higher. Sellers are clearly parked there, and a genuine continuation needs to absorb them. The pullback since that rejection has been shallow and orderly, with small candle bodies and no sustained wave of selling, which is the profile of a pause rather than a reversal.
Levels that matter
Support runs in layers. The first is 1.8700 to 1.8810, where the trendline and the 50-day average overlap. Beneath that, the 200-day average at 1.8562 is the level that would decide whether the whole advance is still intact.
Resistance starts at 1.8950 and finishes at the 1.9043 high. A daily close above 1.9043 would put the pair in fresh 12-month territory with very little historical structure to slow it down.
How the idea could play out
The constructive case is simply that support does its job. Buying into the 1.8760 to 1.8810 area with protection under 1.8562 gives roughly 250 pips of risk against a first target at 1.8950 and a second at 1.9043. That is a modest reward on the first leg, which is why the second target carries most of the value in this trade.
Traders who prefer confirmation over anticipation can wait for a daily close back above 1.8880 before committing. It costs some of the move but removes the scenario where support simply fails on the first test.
What would invalidate it
Two things would end the idea. A daily close below 1.8700 would break both the trendline and the 50-day average at once, which usually leads to a deeper retracement toward the 200-day. And a rejection at 1.8950 that produces a lower high would suggest the pair is building a top rather than a base, in which case the correct read shifts from accumulation to distribution.
Managing the position
This is a cross rate, which means it responds to sterling news and Canadian news independently. Bank of England commentary, UK inflation prints, Bank of Canada decisions and crude oil moves can all shift it, sometimes in opposite directions on the same day. That makes wide stops and modest size a more sensible combination than tight stops and large size.
Scaling out at 1.8950 and moving the stop to break-even removes the worst outcome, which is watching a profitable position round-trip back through entry.
The bottom line
GBP/CAD is doing what healthy trends do: pausing at support instead of collapsing through it. The setup is not dramatic and it does not need to be. The levels are clear, the risk is definable, and the market will settle the argument at 1.8700 or 1.9043 soon enough.
Becoin.net Premium Forecast - Becoin.net Tariff Plan
This analysis is a technical study prepared for educational purposes. It is not investment advice, and no outcome described here is guaranteed. Trade only with capital you can afford to lose.

The Day I Stopped Trading and Finally Started Making Money
It was a rainy Tuesday morning, and I was staring at my screen with a familiar knot in my stomach. The previous three days had been a slow, agonizing slide into the red. I had given back two weeks of hard-earned profits in less than seventy-two hours. Every asset I clicked on looked like a […]

WTI reaches $89.43 as Brent clears $95 on renewed supply risk
WTI traded near $89.43 while Brent moved above $95 as Middle East shipping risk lifted crude for a fifth session. Key levels, catalysts and invalidation.

Bitcoin slips to $65,741 as oil and yields test the breakout
Bitcoin is near $65,741 as rising oil and Treasury yields test the $65.7K breakout floor. Here are the levels that confirm or invalidate the move.

How Liquidity Affects Day Trading Results
When I first started trading day trading, I believed success was all about finding the perfect indicator. I spent weeks testing moving averages, RSI settings, support and resistance levels, and dozens of YouTube strategies that promised easy wins. Some worked for a few trades, but most failed. What confused me was that the same setup […]

Which Broker Has Better Risk Management Tools?
The burning smell of my own account blowing up is a scent I will never forget. It was a rainy Tuesday afternoon a few years back. I sat huddled over my laptop, watching a currency pair oscillate. Confident, arrogant, and entirely unprotected, I clicked buy. Minutes later, a sudden market spike completely wiped out my […]

Chasing Safety in a High-Stakes World: My Quest for the Best Low-Risk Trading Platforms
I still remember the sinking feeling in my stomach when I lost my first tiny trading account. It wasn’t a massive fortune, but it was mine. That night, I realized a brutal truth about this industry: most beginners fail not because they lack passion, but because they dive into high-risk environments without a life jacket. […]