GBP/NZD Forecast: 2.2980 Neckline Decides the Next Range Break
The GBP/NZD forecast is a coil, not a trend
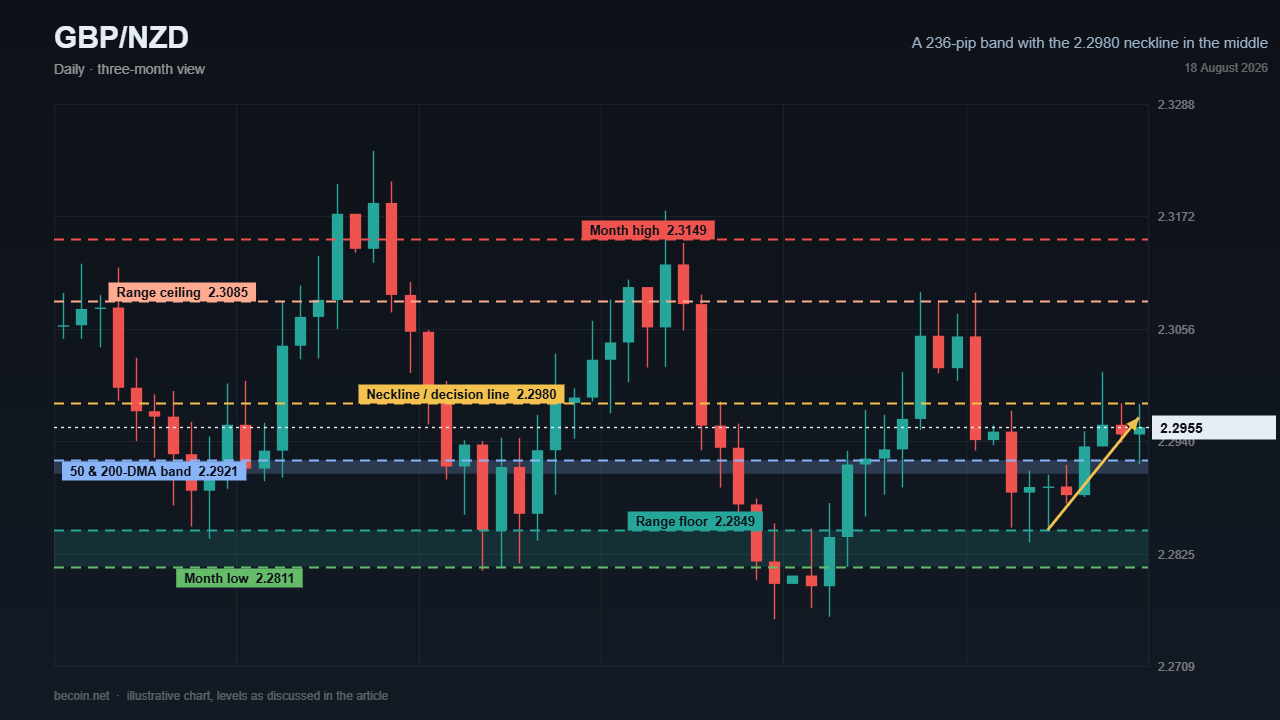
Sterling-kiwi has spent the last month doing very little, and the way it has done very little is the interesting part. Twenty-four consecutive reference fixings all landed between 2.2849 and 2.3085, a band of 236 pips, with an average of almost exactly 2.2977. The pair is trading within thirty pips of that average right now. On a cross that routinely covers 300 pips in a week, a month of oscillation around a single mean is compression, and compression on a cross usually resolves through an event rather than through drift.
The event is already on the calendar. The Reserve Bank of New Zealand meets on 2 September and the Bank of England does not meet until 17 September, which means the kiwi side of this pair gets its catalyst a full fortnight before the pound side does. That asymmetry is the single most useful thing to know about this chart.
A 236-pip band that has held for a month
The boundaries are worth writing down precisely. On closing basis the range runs 2.2849 to 2.3085; on an intraday basis it widens to 2.2811 and 2.3149. Use the closing levels for structure and the intraday levels for stops, because that is roughly how the order book is arranged. Sellers have shown up at the top of the band four times without ever managing a close above it, and buyers have defended the bottom of the band with the same consistency.
What sits inside the band is more unusual than the band itself. The 50-day moving average is around 2.2907 and the 200-day is around 2.2921, which puts them fourteen pips apart. Spot is within about thirty pips of both. Technical scanners currently print a sell rating on this cross, but with price and two major averages stacked inside a thirty-pip window, that rating carries essentially no information. It is a coin flip dressed up as a signal, and it should be treated as such.
2.2980 is the line both camps are watching
The level that actually matters is a little above the averages. Around 2.2970 to 2.2990 sits the neckline of an inverse head-and-shoulders that several published analyses have drawn on the daily chart, and price is sitting directly on it. Necklines are only meaningful when they are confirmed, and this one has not been; the pattern is a proposal, not a fact. But it is a proposal that produces clean, testable levels, which is more than most patterns manage.
If the pair closes above 2.2990 and holds it, the published upside objectives cluster at 2.3090 and 2.3170, which lines up neatly with the top of the observed range and the intraday high. If it fails there, the bears get their trendline break and the most-cited downside target sits far below the current band at 2.2500. Note the asymmetry in those targets: the bull case is asking for a hundred and fifty pips, the bear case for four hundred and fifty. That is a hint about how each camp is sizing its conviction.
The carry favours sterling, the direction of travel favours the kiwi
The Bank of England is at 3.75% and the Reserve Bank of New Zealand at 2.50%, so a long position in this cross collects roughly 125 basis points a year. That is the entire foundation of the bullish case, and it is a real edge.
The problem is that carry is a level and markets trade the change. The RBNZ raised rates 25 basis points on 8 July, its first increase in three years, and signalled that further moves could arrive sooner and more sharply than its own projections implied. The Bank of England, by contrast, held at its July meeting on a 6-3 vote. New Zealand headline inflation is projected to peak above 4% this quarter while inflation expectations remain anchored close to the 2% midpoint, which is precisely the combination that lets a central bank keep tightening without losing credibility. A differential of 125 basis points that is narrowing is a weaker argument than a differential of 125 basis points that is stable, and this one is narrowing. Rate-path scenarios and the levels updated through both meetings are covered in the Becoin.net Premium Forecast.
The counterweights are genuine. New Zealand's manufacturing index has slipped from 60.1 to 54.3, and the kiwi still carries meaningful sensitivity to Chinese demand, so a soft patch in either would undercut the hawkish story quickly.
How the setup is being framed
Published views on this cross are as polarised as any pair on the board right now, which is what a month of range trading tends to produce. One camp draws the inverse head-and-shoulders, calls the neckline at 2.2980 and buys the confirmation for 2.3090 and 2.3170. Another camp draws a broken trendline and a supply rejection just above 2.3030 and sells for 2.2500. A third simply trades the 125-basis-point differential and holds through the noise with a target up near 2.3500.
All three can be right at different points over the next month, which is the practical problem. A range this tight rewards patience and punishes leverage, because the distance between a sensible entry and a sensible stop is often smaller than a single event-driven candle. Before the 2 September decision it is worth checking what your account actually permits in terms of position size and overnight exposure; the tiers and their limits are listed on the Becoin.net Tariff Plans page.
The level that ends the thesis
Two lines settle this. A daily close above 2.2990 confirms the neckline, puts 2.3085 back in play and makes 2.3170 the realistic objective, with the carry argument doing the heavy lifting from there. A daily close below 2.2849 breaks the month-long floor, removes the pattern entirely and hands the chart to the sellers, with 2.2811 as the first stop and the published 2.2500 target becoming the live path rather than a talking point. Until one of those closes prints, this is a mean-reverting cross around 2.2977 and nothing more, and the RBNZ almost certainly decides which one comes first.

How Liquidity Affects Day Trading Results
When I first started trading day trading, I believed success was all about finding the perfect indicator. I spent weeks testing moving averages, RSI settings, support and resistance levels, and dozens of YouTube strategies that promised easy wins. Some worked for a few trades, but most failed. What confused me was that the same setup […]

Finding My Perfect Workspace: The Search for the Best Broker for My Daily Trading Routine
The alarm goes off at 6:00 AM. By 6:30 AM, I am sitting in front of my monitors with a steaming mug of black coffee. The house is completely quiet, the market is preparing its next major move, and my charts are completely bare. This is my daily sanctuary. For a long time, this morning […]

Top 3 Trading Platforms That Actually Pay (Proof-Based)
Choosing the wrong broker at the start is where most traders fail. Not because they lack strategy but because they end up stuck with slow withdrawals, poor execution, or confusing platforms that break decision flow. If your goal is to find the best trading platform for small deposit or the best broker for beginners, you […]

Best Day Trading Brokers for Beginners (2026) — Fast Decision Guide
If you’re searching for the best day trading brokers for beginners, the real problem isn’t lack of options, it’s choosing the wrong platform and learning that mistake after you deposit. Most beginners don’t fail because of strategy. They fail because they start on a broker that has unclear execution, weak withdrawal behavior, or confusing conditions. […]

Is Capital Core Safe or a Scam? What Day Traders Should Know Before Depositing
I’ll be honest: the first time I landed on Capital Core, I didn’t feel excited. I felt suspicious. That might sound strange coming from someone who has spent years around day trading and offshore brokers, but if you’ve traded long enough, you know the pattern. A polished homepage. Big payout claims. A low minimum deposit. […]

EUR/USD holds 1.1414 before the ECB decision: three scenarios
EUR/USD traded near 1.1414 before the ECB’s July decision. Here is what a hold, hawkish hold or surprise hike could mean for 1.1350 and 1.1480.