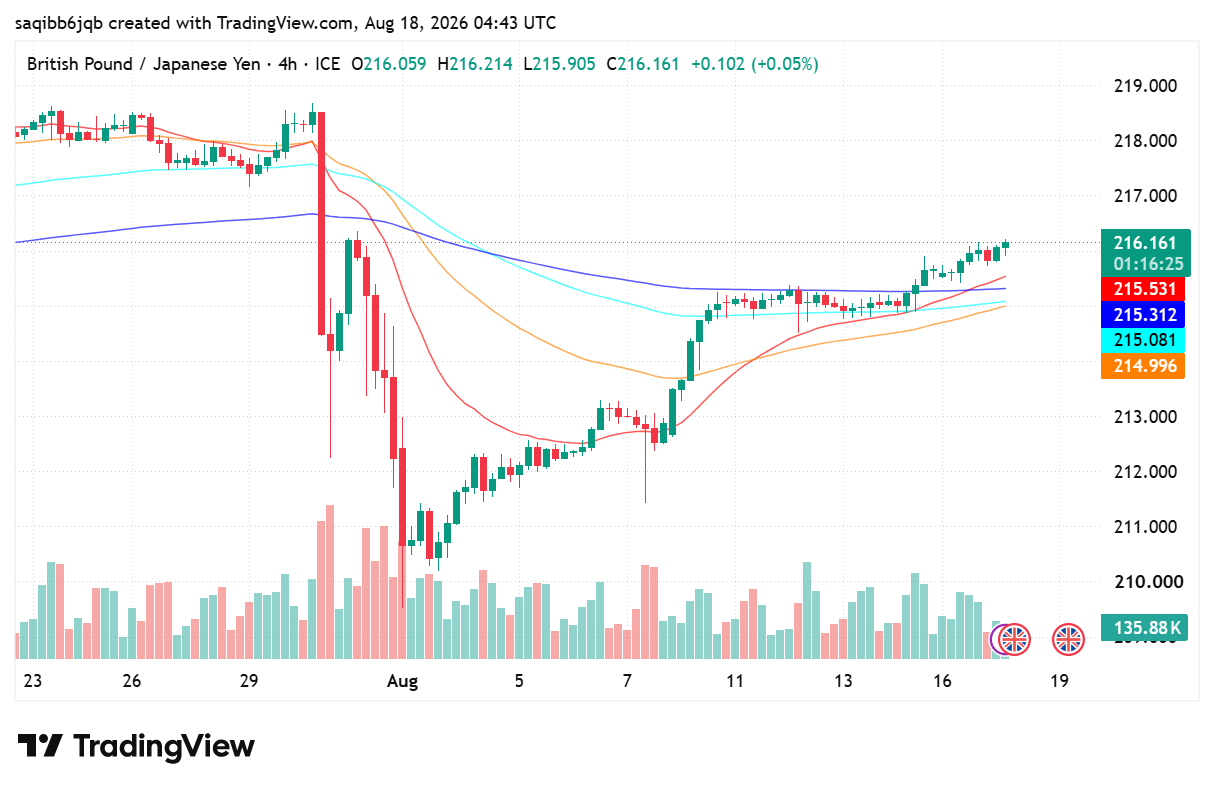
GBP/JPY Forecast: Sterling Recovers to 216.16 Before UK CPI
- Sterling trades at 216.164 against the yen, up 0.15% on the day and roughly six and a half yen above the August low.
- Three Bank of England members voted to raise rates at the July meeting, an unusually hawkish split with UK inflation data due on 19 August.
- The 215.0 to 215.5 band, where four moving averages converge, is where this recovery either holds or fails.
Fundamental Analysis: GBP/JPY
The Bank of England left Bank Rate at 3.75% on 30 July, but the vote was 6-3 and all three dissenters wanted a 25 basis point increase to 4.00%. That is a rare configuration: a committee holding while a third of it argues for tightening. UK CPI was 2.6% in June and the July release lands on 19 August, which makes this week's print the most consequential scheduled event for the pair.
The counterweight is a Bank of Japan that is no longer standing still. It raised its policy rate to 1.00% in June, the highest since 1995, and held there on 31 July with one board member dissenting in favour of 1.25%. It also trimmed its FY2026 inflation forecast to 2.5% from 2.8%, attributing the revision to government measures easing summer energy bills. Japan's national July CPI follows on 21 August.
So both central banks are being pulled in the same direction, which is why the pair mean-reverts rather than trending. The yen's disadvantage narrows every time the BoJ moves; sterling's advantage widens every time a UK inflation print surprises upward. Two data releases inside three days will decide which force wins the rest of August.
Technical Analysis: GBP/JPY
The 4-hour chart is dominated by the collapse that began on 30 July from 218.4 and ran to 209.6 by 5 August, a nine-yen decline in under a week. Everything since has been a grind back up, and the recovery has been strikingly linear, with each successive pullback holding above the previous one. Price now sits at 216.16, just above a converged band of moving averages at 215.53, 215.31, 215.08 and 215.00.
Resistance is at 217.00, the first shelf inside the July decline, and then at 218.40 where the drop originated. Support is the 215.00 to 215.53 average cluster, then 213.00, the mid-point of the August recovery. A close below 212.00 would break the sequence of higher lows and invalidate the recovery read entirely.

EUR/USD holds 1.1414 before the ECB decision: three scenarios
EUR/USD traded near 1.1414 before the ECB’s July decision. Here is what a hold, hawkish hold or surprise hike could mean for 1.1350 and 1.1480.

The Best Broker Without Complicated Features (And Why Simplicity Wins)
Most traders don’t fail because they lack knowledge. They fail because their platform buries them in noise before they even place their first trade. Here’s what actually works. It Started With a Confession From a $10 Trader A reader messaged us a few months back. He had been trying to trade for three weeks, had […]

Which Broker Has Faster Withdrawals? Real 2026 Comparison for Traders
When most beginners choose a broker, they focus on bonuses, signals, or flashy interfaces. But after trading for a while, you realize one thing matters more than almost anything else: How fast can you actually withdraw your money? A broker can look perfect until your first withdrawal request gets stuck in “processing” for three days. […]

The Day I Stopped Trading and Finally Started Making Money
It was a rainy Tuesday morning, and I was staring at my screen with a familiar knot in my stomach. The previous three days had been a slow, agonizing slide into the red. I had given back two weeks of hard-earned profits in less than seventy-two hours. Every asset I clicked on looked like a […]

Which Broker Has Better Risk Management Tools?
The burning smell of my own account blowing up is a scent I will never forget. It was a rainy Tuesday afternoon a few years back. I sat huddled over my laptop, watching a currency pair oscillate. Confident, arrogant, and entirely unprotected, I clicked buy. Minutes later, a sudden market spike completely wiped out my […]

Which Broker Has the Cleanest Interface? Real Comparison for Beginners in 2026
Looking for the cleanest trading interface in 2026? Compare Binomo, IQ Option, Quotex, Deriv, and more based on speed, layout, usability, mobile experience, and beginner friendliness. When most beginners choose a broker, they focus on bonuses, payouts, or deposit methods. But after testing multiple platforms for months, I realized something surprising: A messy interface can […]