
Expiry Selection Using Average True Range
For the first six months of my trading journey, I was trapped in a frustrating cycle. My market direction was right nearly seven times out of ten. I could spot a clean double bottom or a textbook trendline breakout with ease. Yet, my trading account balance kept declining.
The culprit was not my entry strategy. It was my expiry time.
I was choosing option expiries based on gut feeling. If I felt anxious, I picked a 60-second expiry. If I felt cautious, I clicked 5 or 15 minutes. It felt completely arbitrary, and the market punished me for it. I was constantly watching the price move in my predicted direction three seconds after my contract expired, or getting caught in random market noise during a low-volatility crawl.
Everything changed when I stopped treating expiry selection as a guessing game and started treating it as a mathematical relationship driven by Average True Range (ATR).
The Hidden Connection Between Volatility and Time
Most retail option traders focus almost entirely on where the price will go. They spend hours refining RSI divergences or MACD crossovers. However, in short-term options, timing is just as important as direction.
When you open a position on platforms like Pocket Option or Quotex, you are buying a window of time. If that window is too short, market noise will stop you out before the move happens. If that window is too long, the market has time to pull back or completely reverse against you.
The key parameter missing from my trading plan was current market velocity. Markets do not move at a constant speed. A EUR/USD pair during the London-New York overlap moves with far greater momentum than during the late Asian session.
To sync my expiry selection with actual price speed, I turned to the Average True Range indicator, originally created by J. Welles Wilder. ATR measures the average volatility of an asset over a set number of periods, typically 14 candles. Instead of telling you where the price is heading, ATR reveals how many pips or points the asset typically moves per candle right now.
Decoding the ATR Expiry Formula
Once I added a 14-period ATR to my charting setup, I stopped choosing random numbers for my trade durations. I developed a simple three-step method to calculate the minimum time needed for a price move to unfold.
First, I identify the target price level. This is usually the next key support or resistance level, or the height of a breakout pattern.
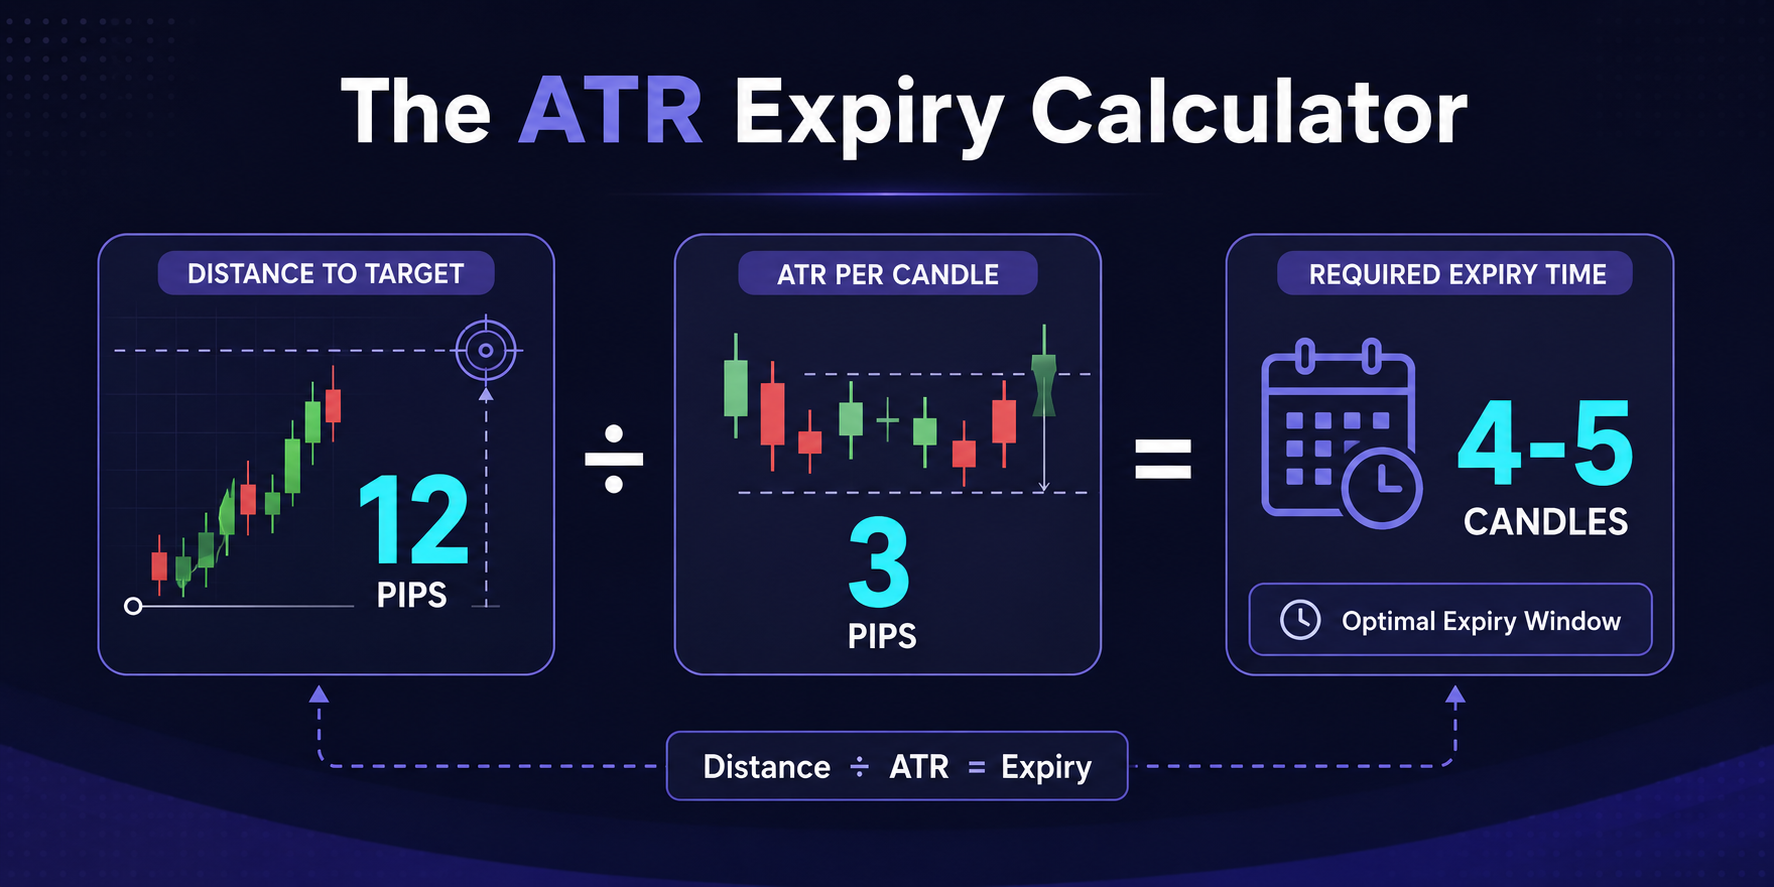
Second, I check the current ATR value on my active timeframe. If I am looking at a 1-minute chart and the ATR reading is 0.00030 (3 pips), it means each 1-minute candle is moving an average of 3 pips from high to low.
Third, I calculate the distance from my entry price to my target level and divide it by the ATR.
For example, if my target level is 12 pips away from my entry, and the 1-minute ATR is 3 pips, I can expect the price to take approximately four candles to reach that level under normal conditions. Adding a buffer candle for minor consolidations gives me a target expiry of 5 minutes.
When I started applying this rule on high-execution platforms like IQ Option and Deriv, my win rate immediately stabilized. I was no longer fighting the natural rhythm of the market.
Tailoring Expiries Across Market Conditions
Volatility is not static. It expands and contracts throughout the trading day. Understanding how to adapt your expiry selection during these shifting regimes is what separates amateur traders from disciplined professionals.
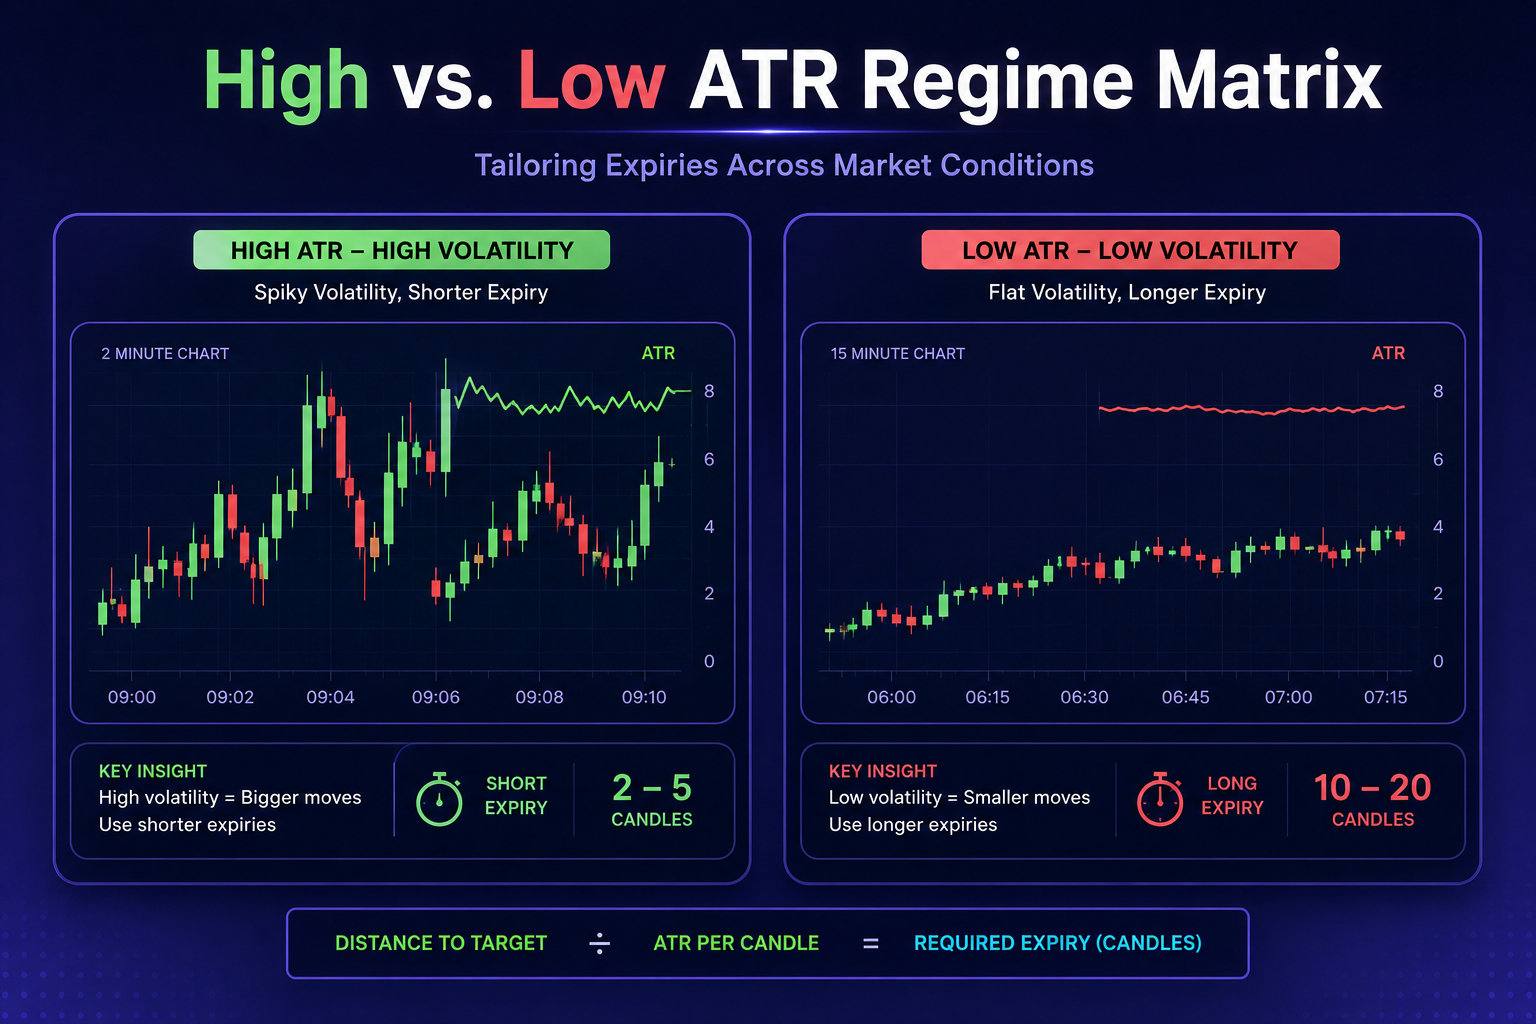
High Volatility Regimes
When the ATR expands significantly above its 20-period moving average, market movements are fast and aggressive. During these periods, price moves reach targets rapidly. Long expiries during high volatility increase your exposure to sudden pullbacks. On platforms such as ExpertOption or Olymp Trade, high volatility setups often favor shorter 1-minute to 3-minute expiries because price travels through structural levels rapidly.
Low Volatility Regimes
When ATR contracts to low levels, price consolidates. Selecting a 60-second expiry during a low ATR period is equivalent to throwing money away. The market simply lacks the energy to move past your entry price, leaving you at the mercy of minor bid-ask fluctuations. During tight consolidation, you must extend your expiry time to 15 minutes or longer, or avoid trading entirely until ATR begins to slope upward.
When trading on advanced platforms like Capital Core, observing ATR expansion out of a tight range provides an early signal that momentum is returning, allowing you to time your entry and expire simultaneously.
Avoid Common Expiry Mistakes
While ATR is an exceptional tool for measuring volatility, I made several mistakes when I first introduced it to my routine.
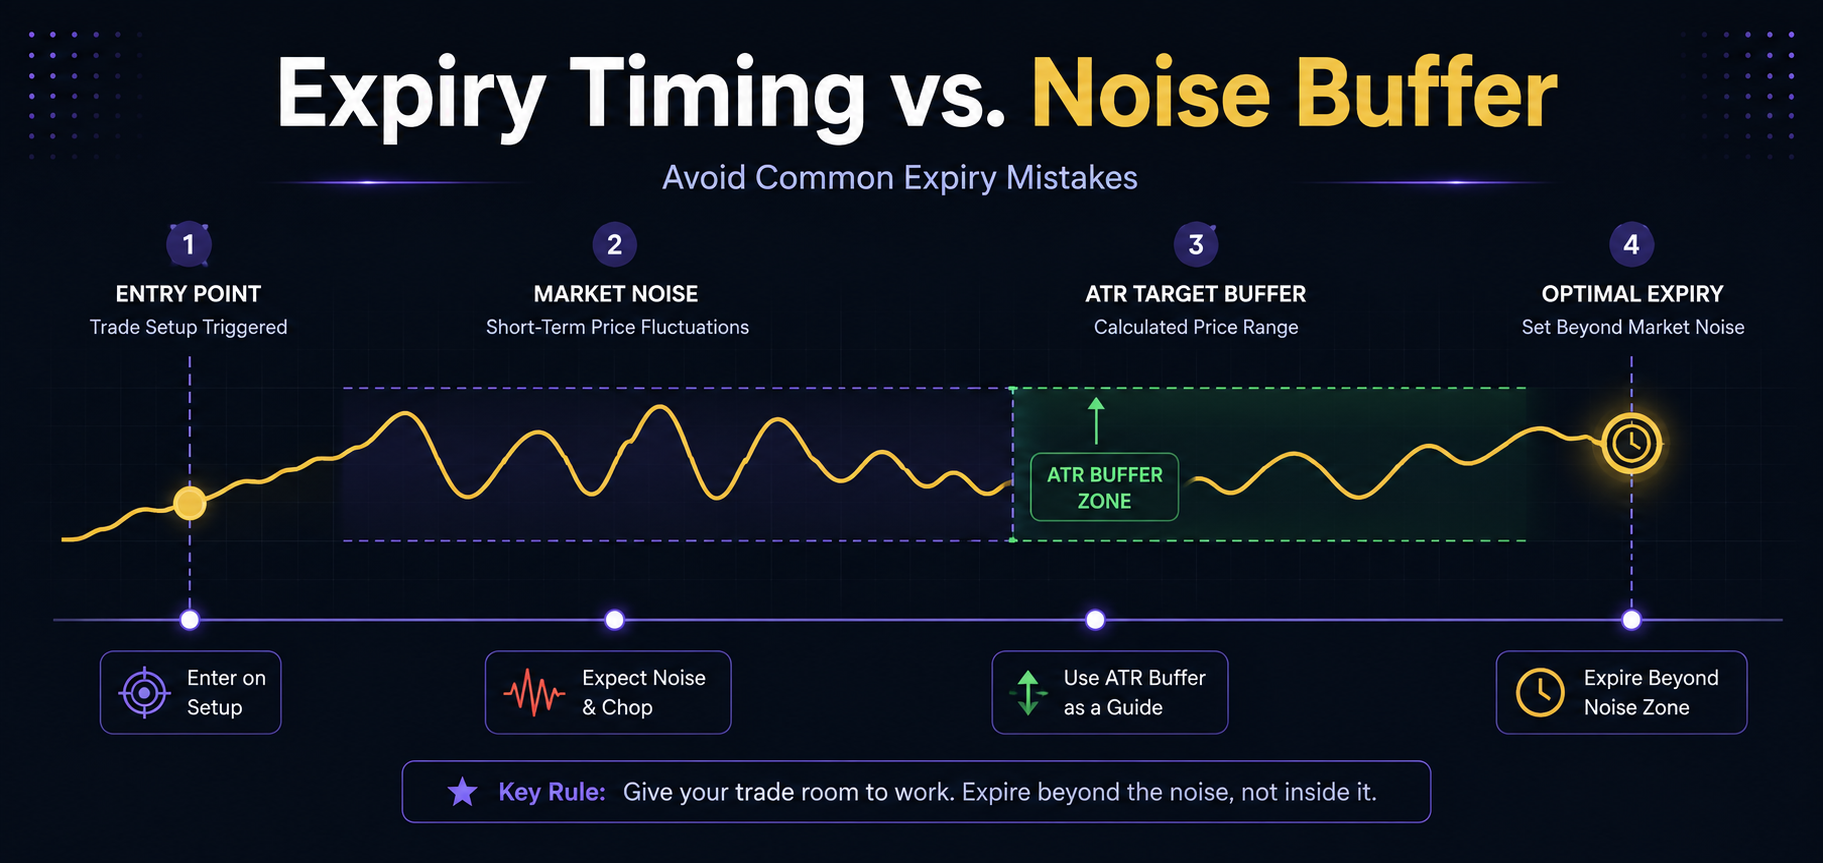
The first mistake was reading ATR on the wrong timeframe. If you intend to execute a 5-minute option trade, reading the ATR on a 1-hour chart will give you inflated values that do not apply to small price movements. Always align your ATR timeframe with your trade horizon. For short-term options, the 1-minute and 5-minute chart ATR readings are your primary reference points.
The second mistake was ignoring economic news releases. During high-impact news, ATR can skyrocket in a single second. While ATR will reflect high volatility, news-driven candles are unpredictable and prone to sudden slippage and reversals. I make it a rule to close positions or pause trading fifteen minutes before and after major economic announcements.
If you want to read deeper into market structure, risk management, and advanced entry strategies, explore the detailed guides available on the Becoin Blog, where we regularly break down professional price action techniques.
A Real Trade Walkthrough
Let us walk through a practical scenario to illustrate how this works in real-time trading.
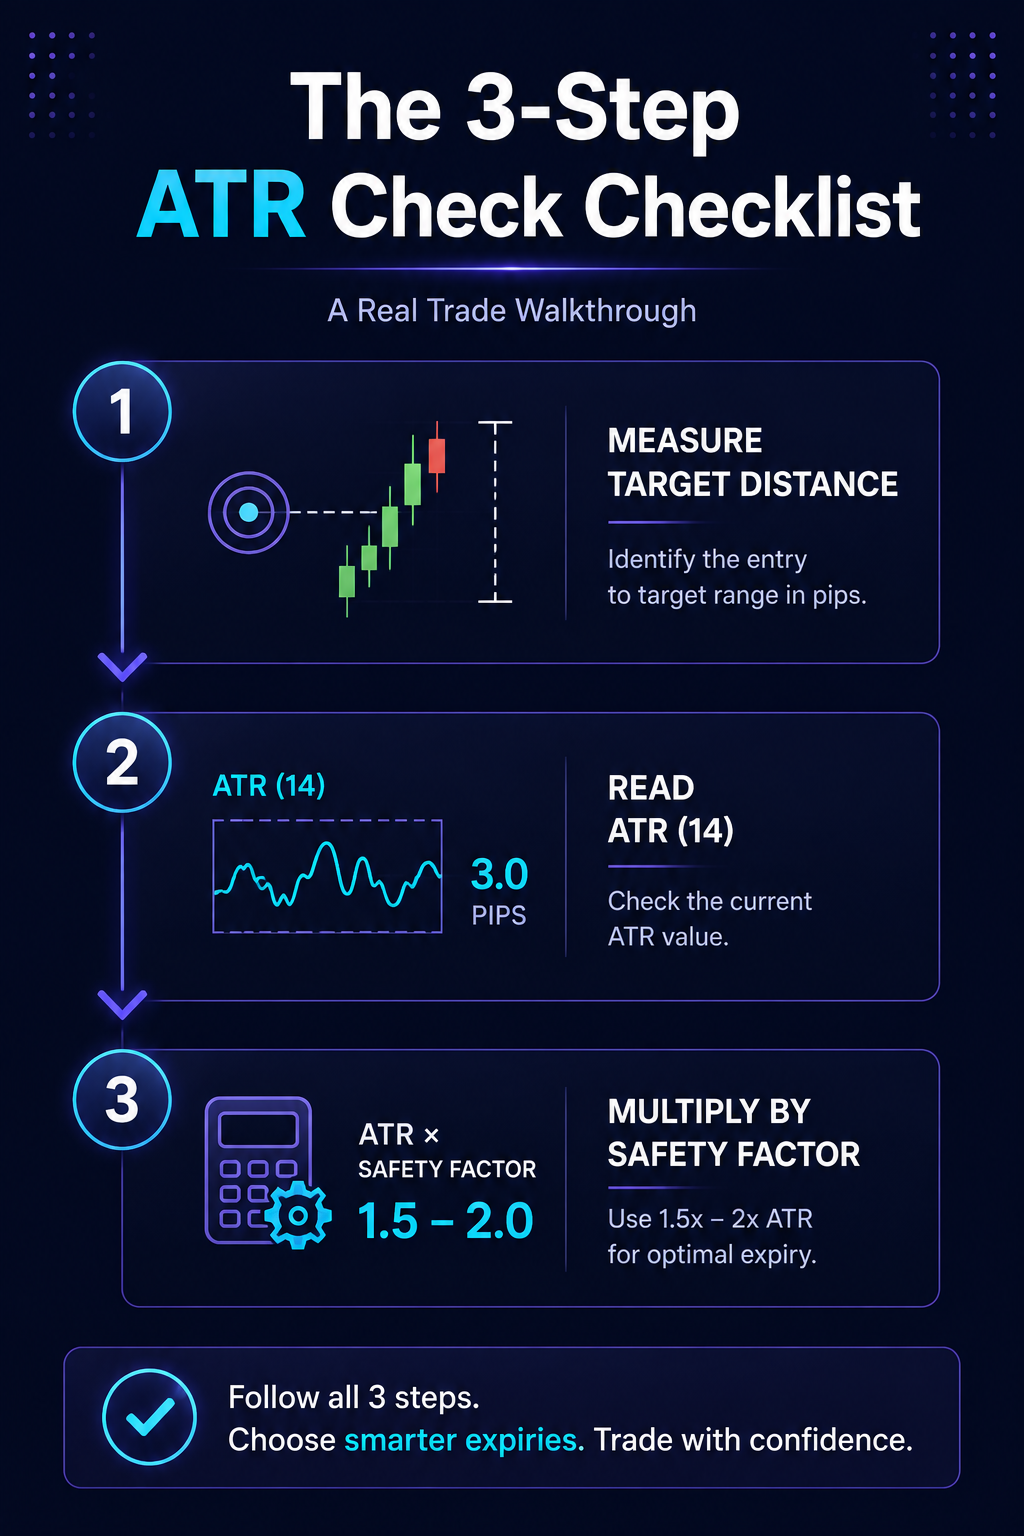
Suppose EUR/USD is approaching a strong resistance level at 1.0850. The current price is 1.0840, meaning there is a 10-pip gap before the price reaches the resistance zone where a rejection is expected.
You look at the 1-minute chart. The ATR (14) indicator is currently reading 0.00020 (2 pips per candle).
You want to trade the continuation toward the resistance level before the reversal occurs.
- Distance to target: 10 pips.
- ATR per 1-minute candle: 2 pips.
- Division: 10 pips / 2 pips = 5 candles (5 minutes).
Instead of guessing whether to open a 1-minute, 10-minute, or 30-minute trade, the ATR calculation clearly indicates that the price requires roughly 5 minutes of average movement to cover the remaining distance. You select a 5-minute Call option. The trade has enough time to develop without exposing you to prolonged market risk after hitting the target level.
To stay updated on high-probability market opportunities and real-time market setups across major currency pairs and assets, check out the live analysis on the Becoin Forecast Hub.
Take Your Trading Edge to the Next Level
Mastering option expiry selection using ATR was the turning point in my personal trading journey. It transformed my approach from emotional guessing into a structured, repeatable process based on real-time market mechanics.
However, mastering volatility is only one piece of the puzzle. Consistent profitability requires a complete framework including precise technical analysis, institutional order flow insights, and disciplined risk management.
If you are ready to stop leaving your trades to chance and want to upgrade your strategy with professional market insights, join our community at Becoin Premium Tariff. Gain access to in-depth daily analysis, premium signals, advanced strategy breakdowns, and exclusive trading tools designed to give you a definitive edge in the markets.

The Clock and the Candle: How I Stopped Guessing the Best Time to Trade Day Trading
I still remember the night I blew my third trading account. It was 11:30 PM. The house was completely quiet, the market charts on my screen were barely crawling, and I was forcing trades out of pure impatience. I kept staring at a flatline asset, placing one-minute positions, convinced that the market owed me a […]

Deriv Volatility 75 Strategy Backtest: What Actually Works After 1,000 Trades?
The first time I tried trading Volatility 75, I thought I had found the perfect market. No news shocks. No central banks. Just clean, continuous price movement. Within two weeks, I blew my first account. That experience forced me to stop guessing and start testing. Instead of chasing indicators or copying strategies from forums, I […]

How Understanding Market Structure Saved My Day Trading
I remember the exact moment my trading account hit zero for the third time in a single month. It was a rainy Tuesday evening, and I was staring at a 1-minute chart on my laptop screen. The price had been moving up aggressively. It looked like a flawless rocket ship to the moon. I clicked […]

The Clock and the Cash: My Journey into the Hidden Rhythm of Session-Based Trading
There was a time when I thought the global financial market was a single, monstrous wave that never stopped moving. I believed that if I sat in front of my monitors long enough, clicking buttons whenever a pretty pattern appeared on my charts, the market would eventually reward my sheer endurance. I was dead wrong. […]

The Day I Stopped Trading and Finally Started Making Money
It was a rainy Tuesday morning, and I was staring at my screen with a familiar knot in my stomach. The previous three days had been a slow, agonizing slide into the red. I had given back two weeks of hard-earned profits in less than seventy-two hours. Every asset I clicked on looked like a […]