EUR/USD Stalls Under Its Falling Channel: Why 1.1550 Is the Line That Matters
The rebound that keeps running into the same wall
Every trending market eventually produces a rally that feels like the turn. EUR/USD is in one of those moments right now. After grinding lower for weeks inside a well-behaved descending channel, the pair has clawed its way back toward 1.1550 and the mood on the euro has quietly improved. The problem is that the rebound has arrived exactly where the previous two rebounds died.
That is the whole story in one sentence. Price is not breaking anything yet. It is testing something.
What the EUR/USD four-hour chart is actually showing
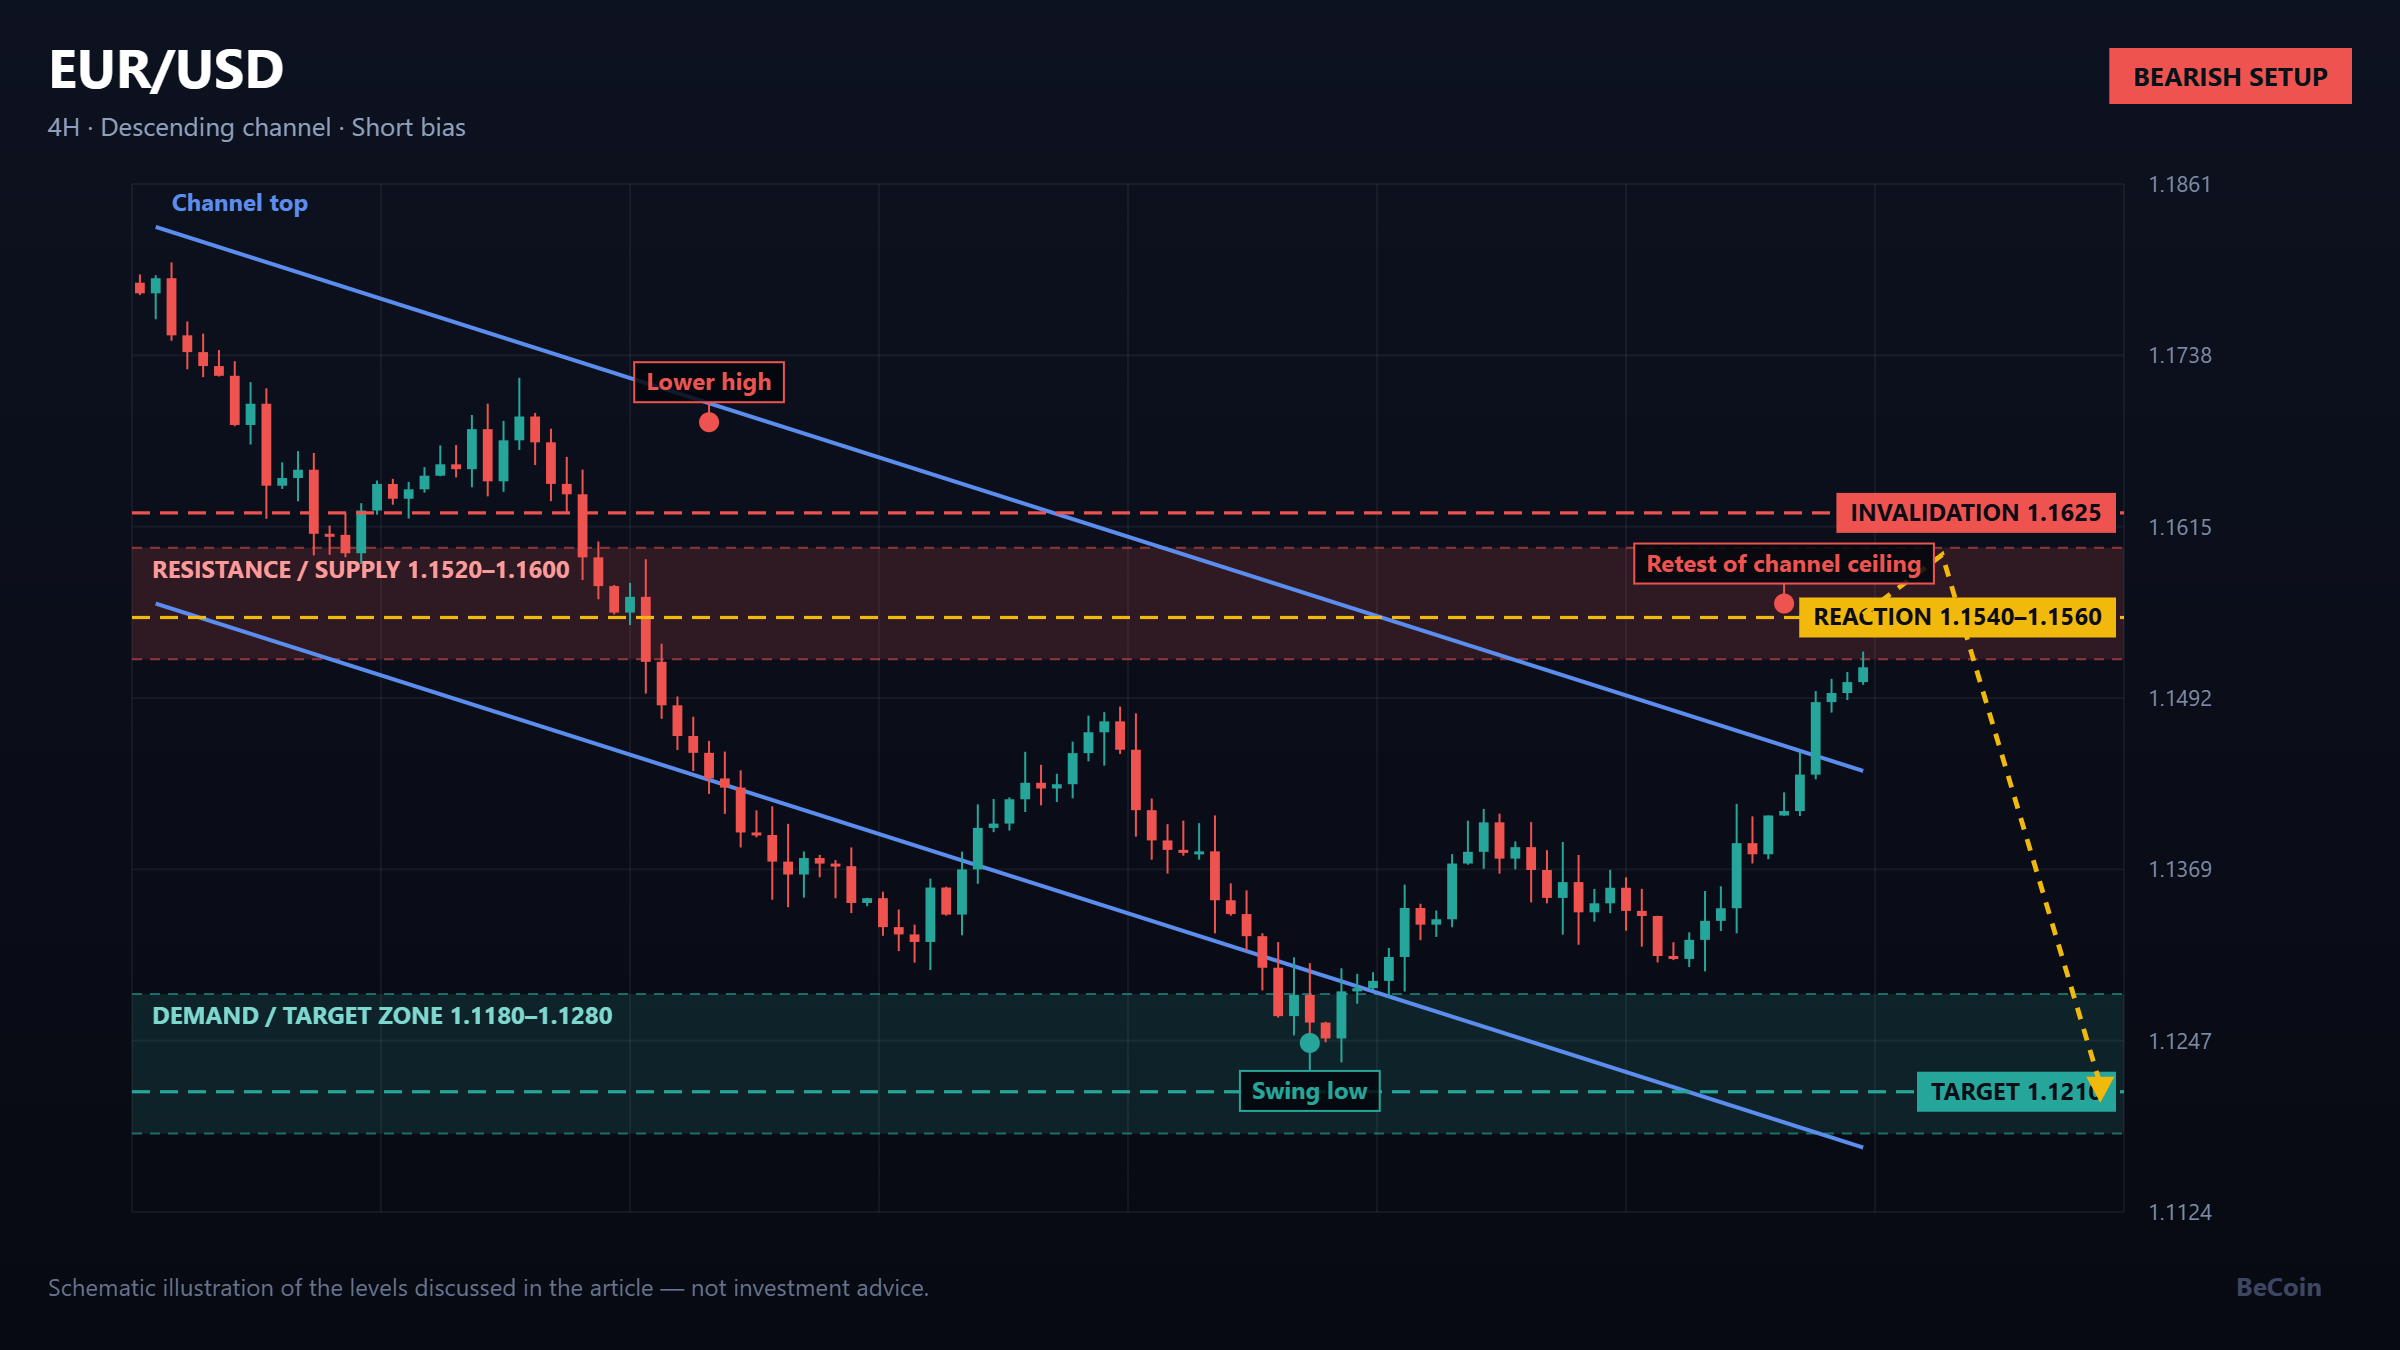
Draw a line across the highs since the top near 1.1790 and you get a downward sloping ceiling that has been touched, respected and rejected repeatedly. The current push has taken price back into contact with that ceiling, and it has done so at the same time as the 1.1520 to 1.1600 supply band, an area where sellers previously distributed on the way down. Two obstacles stacked on top of each other carry more weight than either one alone.
Below, the structure is unambiguous. Lower highs at roughly 1.1690 and 1.1470, a swing low around 1.1245, and no higher high anywhere on the four-hour timeframe. Until that changes, the burden of proof sits with the buyers.
The levels worth writing down
The reaction zone sits between 1.1520 and 1.1600. If sellers are still in control, the rejection should show up here as a bearish close on expanding volume rather than a slow drift sideways. A daily close above 1.1625 does the opposite: it puts price outside the channel and above the supply band at the same time, which is usually enough to retire the bearish structure entirely.
On the downside, the first meaningful shelf is the old swing low near 1.1245, and beneath it the demand pocket between 1.1180 and 1.1280 where the last real buying interest appeared. A measured move from the channel ceiling projects roughly toward 1.1210, which is where the risk-to-reward on a short becomes interesting rather than marginal.
The macro backdrop nobody can ignore
Technicals set the map, but the dollar side of this pair is driven by rates. Payrolls and inflation prints remain the two events capable of invalidating any four-hour structure in a single candle. A firm labour market reading supports the argument that the Federal Reserve has room to stay restrictive, which pressures EUR/USD. A soft print does the reverse and can easily push price through the channel ceiling before the chart has time to reject it.
This is why event risk and technical levels have to be read together. A short taken into a data release is not a technical trade, it is a coin flip with a chart attached.
How a patient trader would handle it
Reacting to the level rather than predicting it is the practical approach. That means waiting for price to enter the 1.1540 to 1.1560 area and then letting the market show a rejection candle before committing, rather than selling blindly into strength. Position size should assume the stop at 1.1625 will be hit, because sometimes it will be.
If the rejection never comes and price accepts above the channel, the correct response is to stand aside and reassess rather than to add. The structure would then be broken, and a broken structure is information, not an insult.
Bottom line
EUR/USD is at a decision point, not a conclusion. The bearish case remains intact while price stays capped by the descending channel and the 1.1520 to 1.1600 supply band, with 1.1210 the logical downside objective. Above 1.1625 on a daily close, the trend argument flips and the pair earns the benefit of the doubt.
Becoin.net Premium Forecast - Becoin.net Tariff Plans
This article is educational market commentary and is not investment advice. Trade your own plan and manage risk accordingly.

EUR/USD holds 1.1414 before the ECB decision: three scenarios
EUR/USD traded near 1.1414 before the ECB’s July decision. Here is what a hold, hawkish hold or surprise hike could mean for 1.1350 and 1.1480.

Trading Currency Strength Instead of Single Pairs
It was a Tuesday afternoon when I realized I was fighting a losing battle against a ghost. My screen was a chaotic web of indicators. I had the EUR/USD chart open, a moving average crossing over here, a relative strength index flashing oversold there, and a price action setup that looked textbook perfect. I clicked […]

Which Broker Has Faster Withdrawals? Real 2026 Comparison for Traders
When most beginners choose a broker, they focus on bonuses, signals, or flashy interfaces. But after trading for a while, you realize one thing matters more than almost anything else: How fast can you actually withdraw your money? A broker can look perfect until your first withdrawal request gets stuck in “processing” for three days. […]

Which Broker Has Better Risk Management Tools?
The burning smell of my own account blowing up is a scent I will never forget. It was a rainy Tuesday afternoon a few years back. I sat huddled over my laptop, watching a currency pair oscillate. Confident, arrogant, and entirely unprotected, I clicked buy. Minutes later, a sudden market spike completely wiped out my […]

The Day I Lost My First Ten Dollars: My Hunt for the Best Mobile Trading App for Beginners
I still remember the exact shape of the cloud outside my window when my first live trade ended in the red. It was a crisp morning, and I was sitting on my couch with a lukewarm cup of coffee, staring at a flashing line on my smartphone screen. I had just deposited ten bucks, convinced […]

Which Broker Is Better for Weekend Trading?
It was a chilly Saturday morning, and while the rest of the world was sleeping in or catching up on shows, I was staring at a completely frozen screen. My usual EUR/USD chart looked like a heart monitor flatlining. The traditional markets were closed. The banks were shut down. For a long time, that was […]