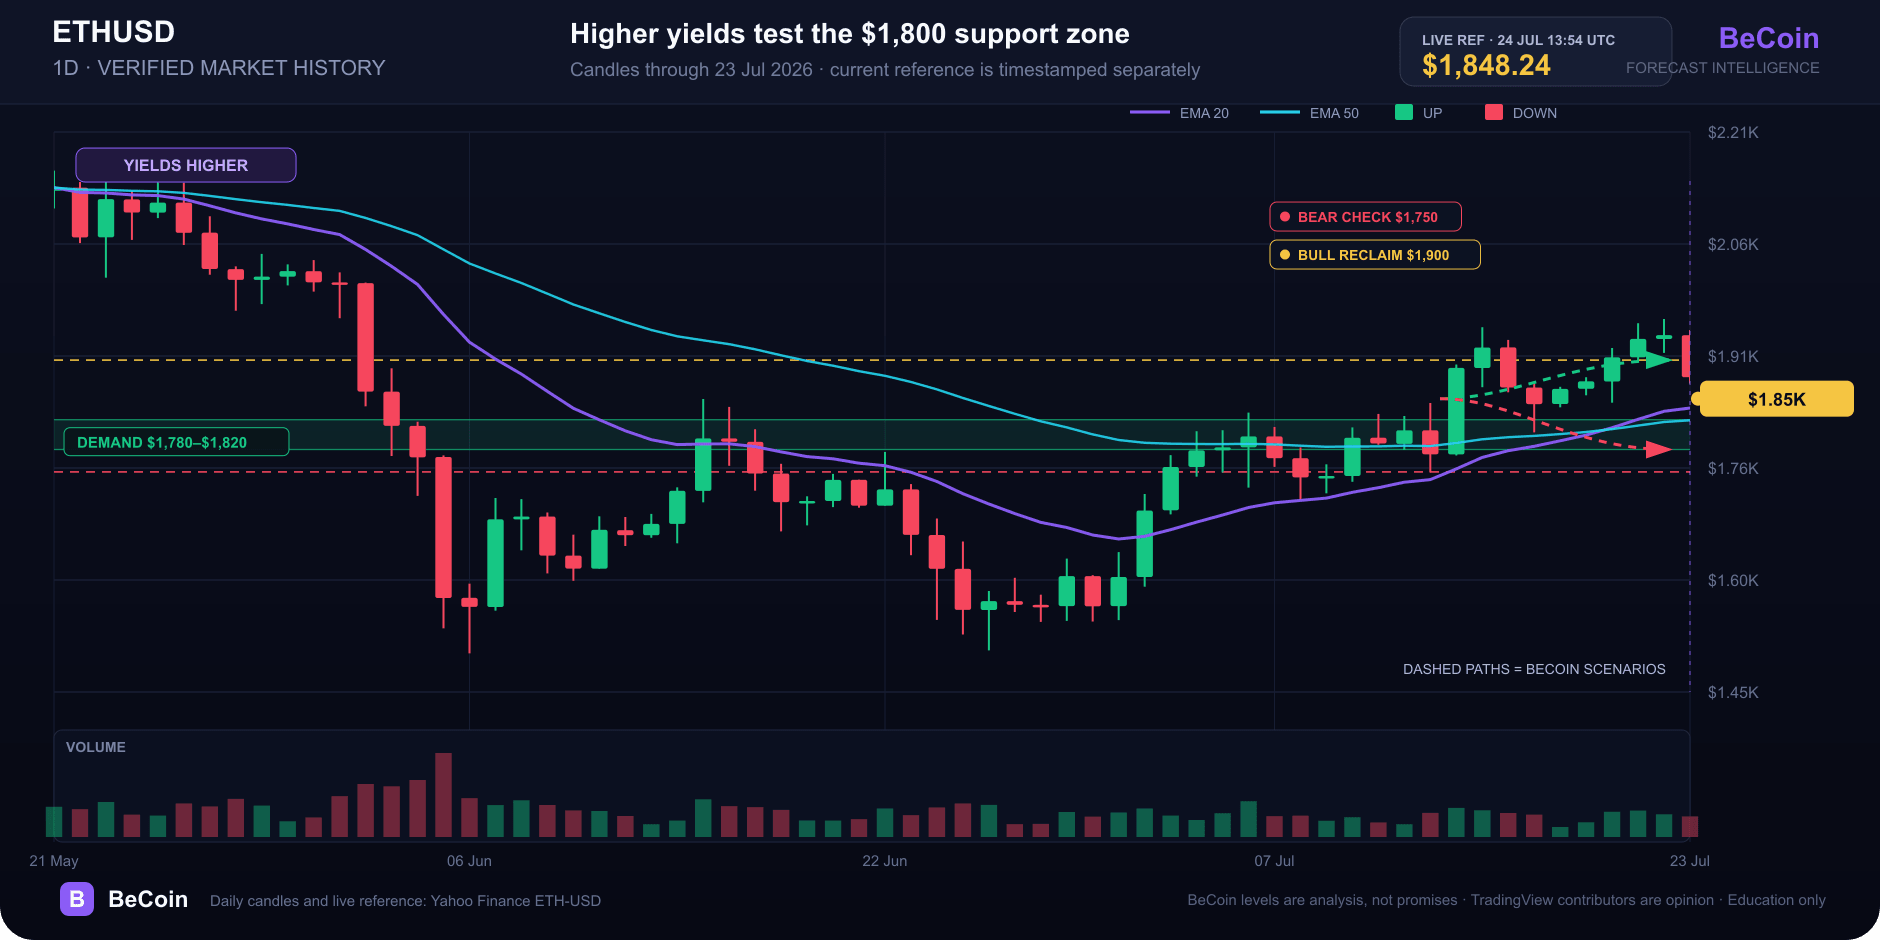
Ethereum falls to $1,848 as higher yields test the $1,800 support zone
Ethereum traded at $1,848.24 at 13:54:46 UTC on July 24, down 2.60% in Yahoo Finance’s live market display. The direct answer is that ETH remains above the $1,800 decision area, but rising Treasury yields have interrupted its recent recovery and brought the lower edge of the range back into focus.
Why it matters
The pressure is cross-asset rather than a new Ethereum protocol event. Reuters reported that long-dated U.S. yields were near multi-decade highs as oil and new tariffs revived inflation concerns. Higher yields make interest-bearing assets more competitive with crypto, while a stronger dollar can tighten financial conditions for risk assets.
Google’s leading result answered the immediate price question and tied the decline to higher yields. Other results emphasized Bitcoin or older Ethereum technicals. BeCoin adds a current ETH-specific decision map and separates verified market data from contributor forecasts.
Technical and market context
The first support band is $1,780–$1,820. Recent TradingView contributors described it as a demand area, while one bearish idea placed resistance at $1,875–$1,950 and downside checkpoints near $1,803 and $1,750. Those are opinions published before today’s full macro move, not verified targets.
The price response at $1,900 is the cleaner signal. A sustained recovery above $1,900 would show buyers are absorbing the yield shock. A daily close below $1,780 would invalidate the short-term recovery structure and expose $1,750, then the broader $1,650–$1,685 area.
BeCoin forecast read
BeCoin’s base case is a volatile $1,780–$1,900 range while bond yields remain elevated. The bull case needs a reclaim of $1,900 with the dollar and long yields stabilizing. The bear case strengthens only after a confirmed close below $1,780. Until then, ETH is testing support rather than confirming a new downtrend.
Track Ethereum forecasts and current levels or test position sizing with the Trading Simulator.
Methodology and sources
Price: Yahoo Finance ETH-USD display, 2026-07-24 13:54:46 UTC. Macro context: Reuters global-markets report published July 24 and updated before the 15:45 UTC research cutoff. Search intent: Google results reviewed July 24; no People Also Ask module appeared for the exact breaking query. Opinion context: TradingView ETHUSD ideas dated July 18–20.
This content is for education only and is not financial advice.
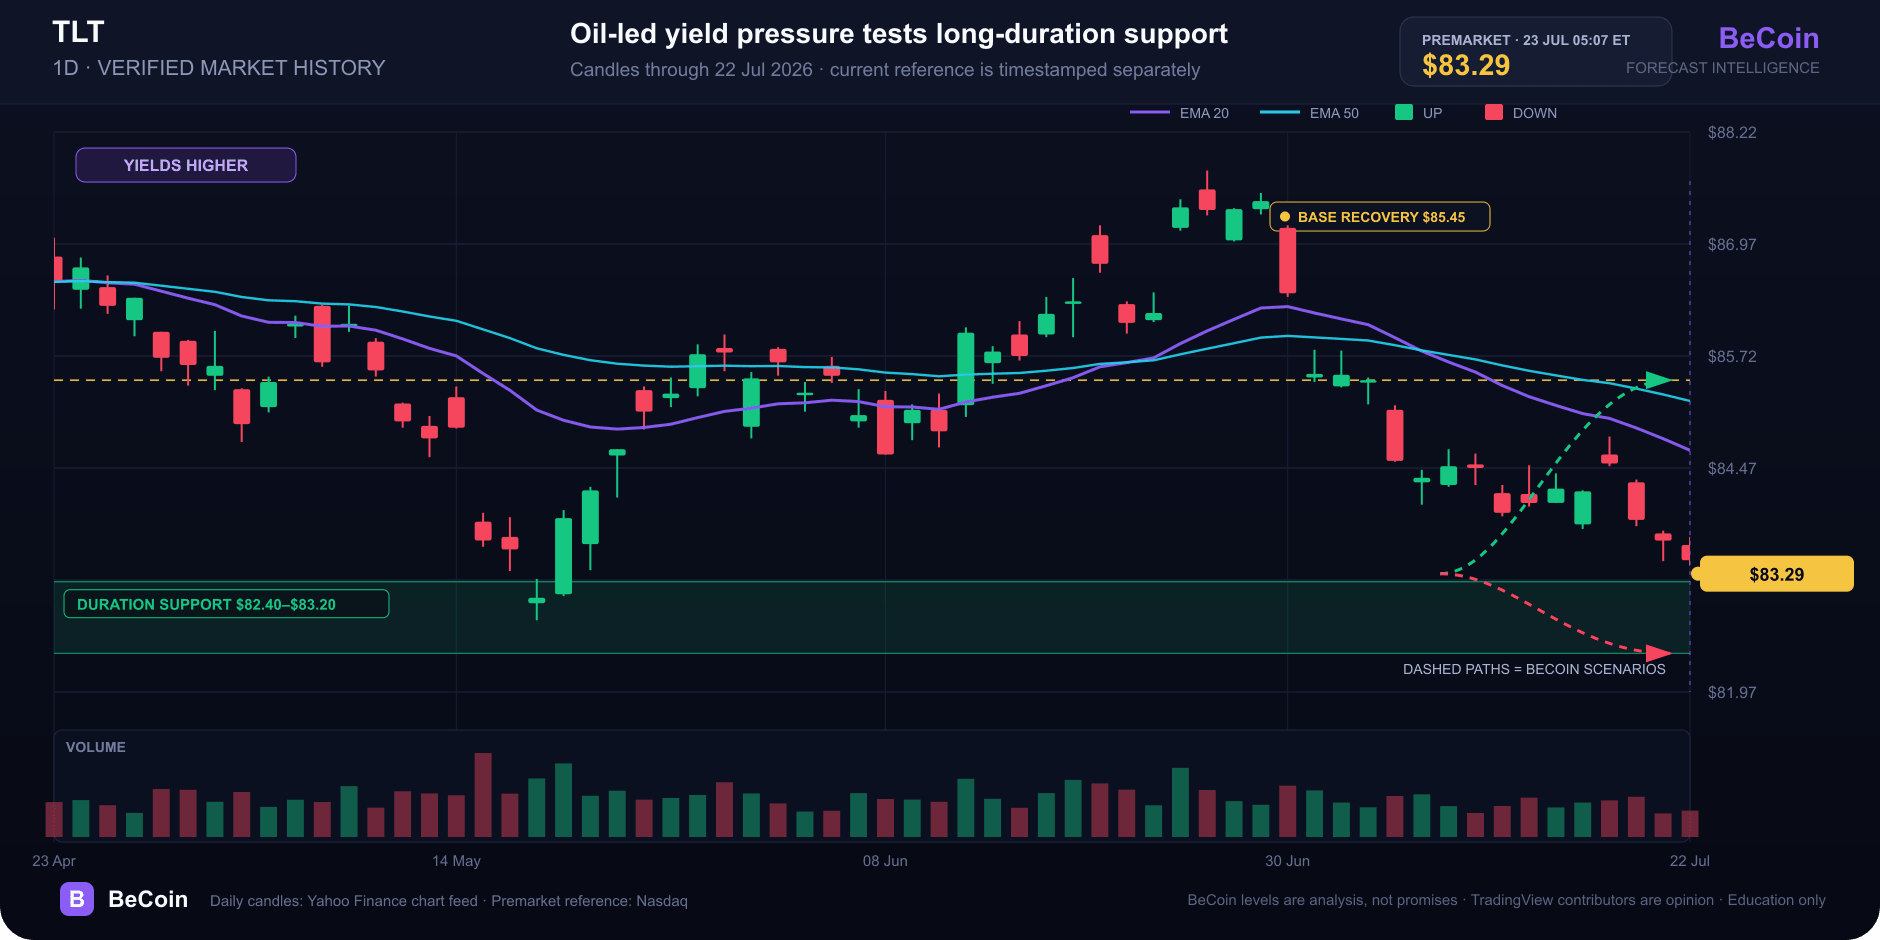
TLT slips to $83.29 as oil pushes long-duration risk back into focus
TLT traded near $83.29 premarket as oil and Treasury yields rose. Here is why duration matters and which levels separate a base from a breakdown.

Bitcoin slips to $65,741 as oil and yields test the breakout
Bitcoin is near $65,741 as rising oil and Treasury yields test the $65.7K breakout floor. Here are the levels that confirm or invalidate the move.

EUR/USD holds 1.1414 before the ECB decision: three scenarios
EUR/USD traded near 1.1414 before the ECB’s July decision. Here is what a hold, hawkish hold or surprise hike could mean for 1.1350 and 1.1480.
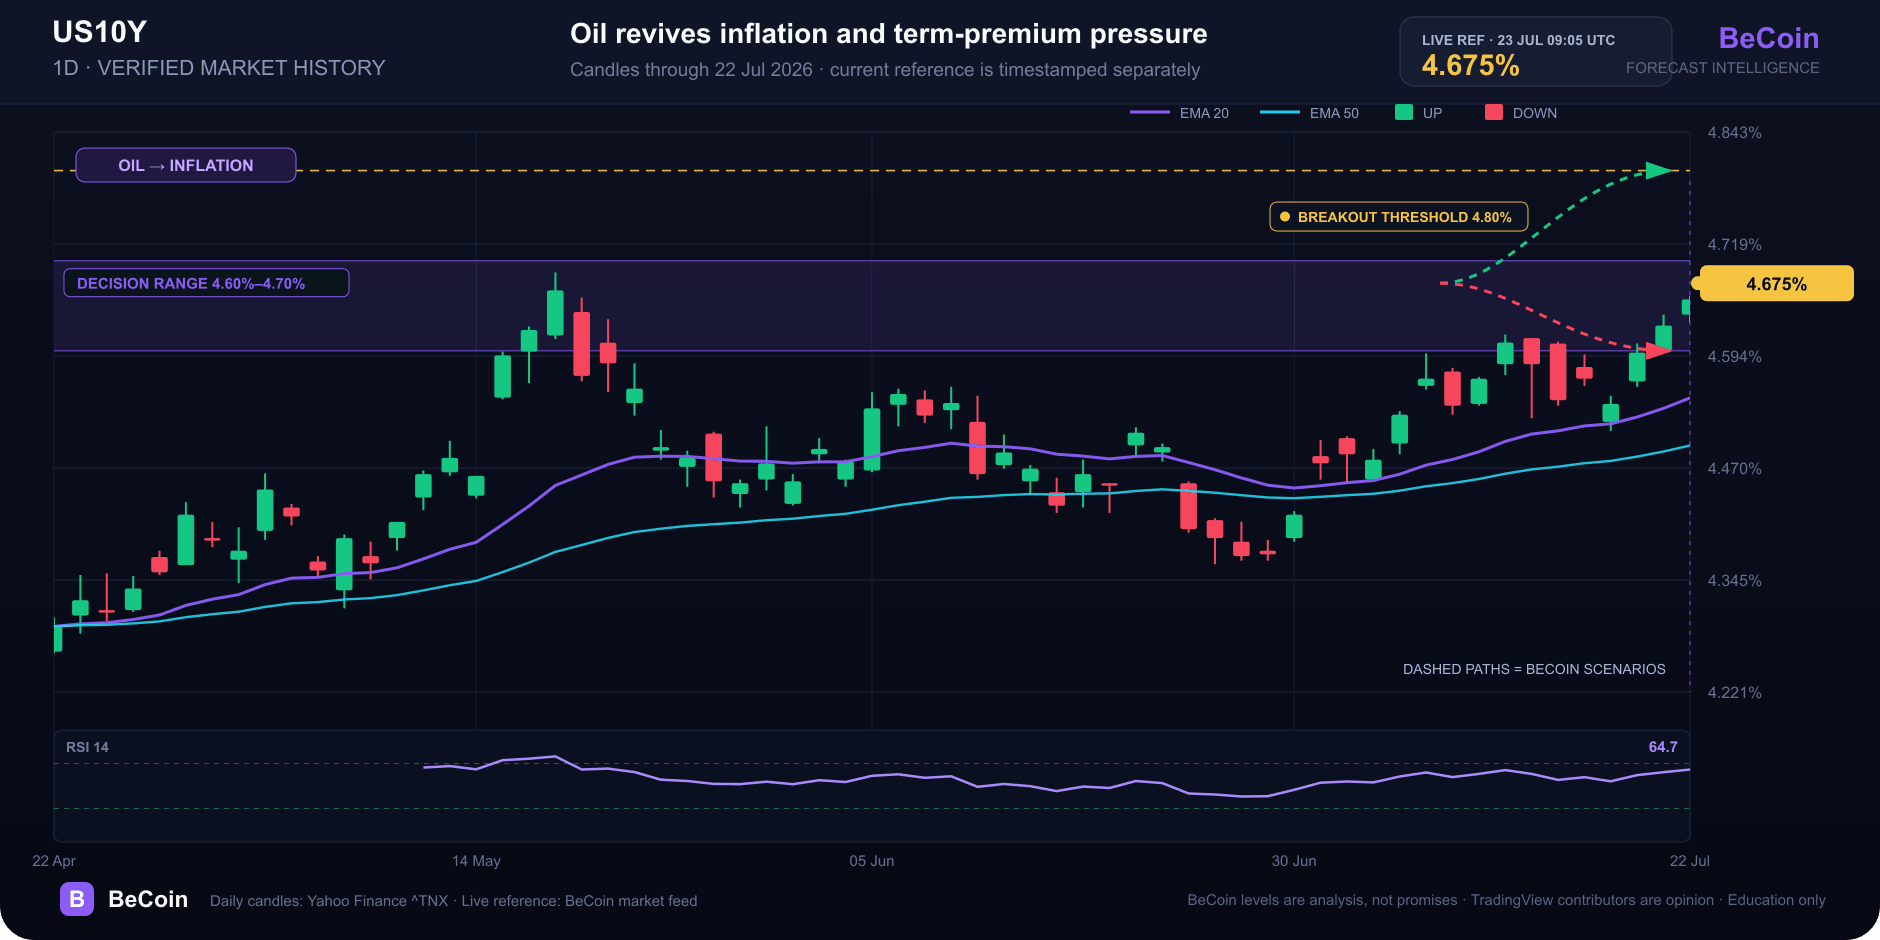
US 10-year yield reaches 4.675% as oil revives inflation pressure
The US 10-year yield reached 4.675% as oil prices rose and markets awaited labor data. What 4.70%, 4.80% and a reversal below 4.60% would mean.

WTI reaches $89.43 as Brent clears $95 on renewed supply risk
WTI traded near $89.43 while Brent moved above $95 as Middle East shipping risk lifted crude for a fifth session. Key levels, catalysts and invalidation.

Alphabet falls to $329.71 premarket as AI spending eclipses cloud growth
Alphabet traded near $329.71 premarket after strong Q2 revenue and cloud growth collided with a much larger AI spending plan. What investors need to watch.