CAD/JPY Forecast: 115.00 Demand Holds With 116.40 as the Real Test
CAD/JPY Forecast: A Textbook Sweep and Reclaim
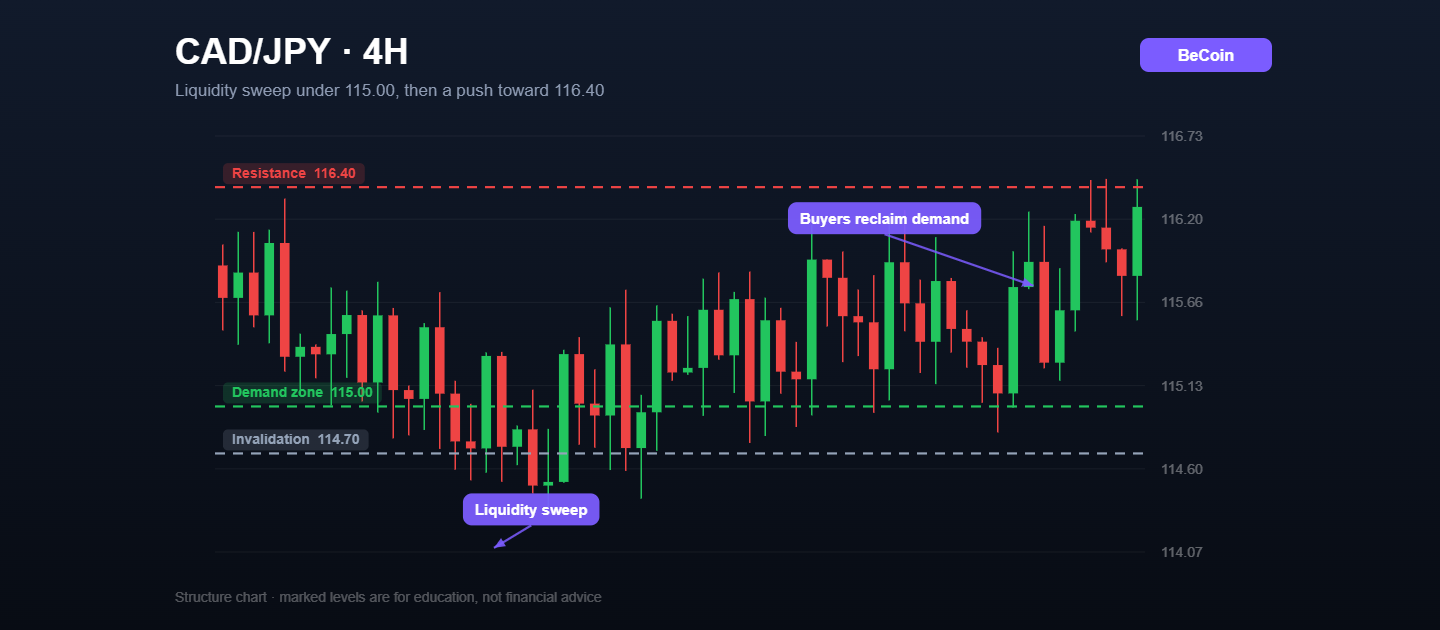
The most useful thing CAD/JPY has done recently is fake people out. Price dipped beneath the 115.00 handle, tripped the obvious cluster of stops sitting under the prior swing low, and then closed back above the zone within a couple of four-hour candles. Traders who had marked 115.00 as a hard floor got stopped out moments before the pair did exactly what they expected. That pattern has a name on almost every chart published about this pair right now: a liquidity sweep followed by a reclaim.
Why the 115.00 Zone Still Matters
A level is not invalidated by a wick through it. It is invalidated by acceptance below it, and CAD/JPY never produced that. The 114.95 to 115.05 band has now been defended three separate times, each with a lower wick and a close back inside. Several published setups anchor their long entries to exactly that band, with stops at 114.70 rather than at the round number itself, precisely because the sweep already showed where the stop hunt lives.
116.40 Is the Level That Decides the Trend
Above current price, the map is straightforward. The first objective most analysts mark is 116.00, which is a psychological handle and the top of the recent consolidation. Beyond that, 116.40 is the level that actually matters, because it is where the last impulsive decline began. A four-hour close above it turns this bounce from a mean reversion into a structural change and puts 117.00 in play. Failure there, and the pair likely rotates back toward 115.30 to look for demand again.
The Fundamental Tension Behind the Range
CAD/JPY is a carry-sensitive cross, and that is exactly why it behaves this way. The Canadian dollar takes its cue from crude and from a Bank of Canada that has been slow to commit, while the yen reacts to every hint of policy normalisation out of Tokyo. When neither side offers a surprise, the pair compresses. When one does, moves in this cross tend to be fast rather than gradual, which is a good argument for defining risk before entry rather than after.
A Practical Way to Frame the Setup
The cleanest structure here is long from 115.10 to 115.40 with invalidation under 114.70, first target 116.00, second target 116.40 and a runner toward 117.00 only if that upper level breaks on a closing basis. Position size should assume the sweep can happen again, because it usually does. If you would rather see these zones tracked and updated as the session develops, Becoin.net Premium Forecast maps the same structure across yen crosses, and Becoin.net Tariff Plans explains which access level suits an intraday approach versus a swing one.
What Would Break the Idea
A four-hour close below 114.70 removes the entire reclaim thesis and shifts attention to 114.20. Until that happens, the balance of evidence on the chart favours the buyers who defended the sweep, not the sellers who chased the break.
Capital Core Verification Process Explained: KYC, Restrictions, and Withdrawal Delays
I learned something the hard way with offshore-style brokers: the smoothest part is usually opening the account, funding it, and placing the first few trades. The real test starts when you try to move money back out. That’s exactly why I wanted to document the Capital Core verification process from a trader’s perspective, not from […]

Why Traders Move from Binomo to Deriv in 2026: The Real Reasons Behind the Switch
If you spend enough time around trading communities, you’ll notice a pattern. Many traders start with Binomo. Then, after a few months, a surprising number begin looking at Deriv. Some switch completely. Others keep both accounts but gradually move most of their trading activity to Deriv. I noticed this trend while talking to beginner traders […]

Can You Start Trading with $10 on Deriv?
A lot of beginners enter trading with the same question: “Is $10 actually enough to start trading on Deriv?” The short answer is yes. But the real answer is more complicated. You can start with $10 on Deriv, but whether you can survive, learn, and grow that account depends entirely on your expectations, discipline, and […]

Binomo vs IQ Option Mobile App Comparison 2026: Which Trading App Is Better for Beginners?
Mobile trading is no longer a backup option for traders. For many beginners, the smartphone app becomes the main trading workstation. Whether you are entering quick trades during a lunch break or analyzing charts late at night, the quality of a broker’s mobile app can directly impact your results. Two platforms that continue to dominate […]

$10 to $50 Trading Challenge – Strategy + Real Results (Case Study)
Turning $10 into $50 sounds easy until you actually try it. Small accounts expose every weakness in your trading. One bad decision can erase hours of progress, and emotional trading becomes much harder to control when every dollar matters. This case study breaks down how a $10 account was realistically grown to $50 using a […]

I Started with $10 on Quotex – Day 1 Results (Real Case Study)
Most beginner traders ask the same question:Can you actually grow a small account like $10? Instead of theory, I decided to test it in real conditions. This is a Day 1 case study of trading with $10 on Quotex, documenting everything from setup to execution, mistakes, emotions, and actual results. No hype, no fake screenshots, […]