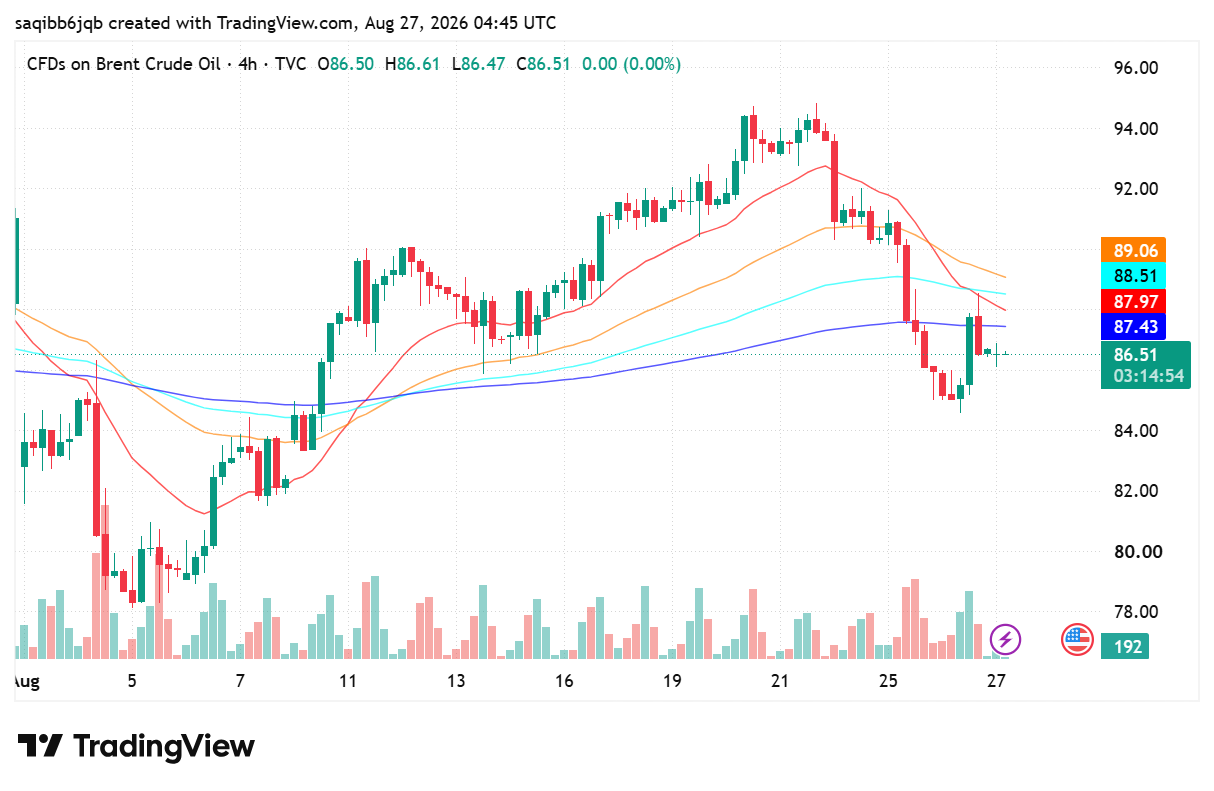
Brent Crude Oil Forecast: $86.54 Under the 89.06 Band
- Brent trades at $86.54, effectively flat on the session but nine dollars below its 21 August high.
- Global observed stocks fell 69 mb in July to under 7.9 billion barrels, the lowest since April 2025.
- The 87.43-89.06 moving-average band is now overhead and decides whether this is a pause or a reversal.
Fundamental Analysis: Brent Crude Oil
The supply side remains severely impaired. The IEA puts global oil supply at 101.5 mb/d in July, some 6.3 mb/d below year-ago levels, with regional exports falling a further 2.1 mb/d to 15 mb/d after the Strait of Hormuz was effectively closed again in early July. Gulf production recovered to 23.9 mb/d but remains 8.3 mb/d beneath pre-conflict levels, with that volume still shut in. Inventories reflect it: observed stocks fell 69 mb in July to below 7.9 billion barrels, and cumulative draws since late February total 410 mb.
The counterweight is demand destruction, and it is substantial. The IEA now expects world consumption to fall 1.6 mb/d across 2026, with the second quarter contraction of 4.9 mb/d easing to 2.8 mb/d in the third. Prices in the nineties have done exactly what prices in the nineties do — they have rationed consumption, and the agency expects demand growth to resume only in 2027.
The balance is a market where both blades of the scissors are closing at once. That produces enormous range without direction, which is precisely what July delivered: a $40 trading band inside a single month. The chart's current weakness is the demand side asserting itself, not the supply constraint resolving.
Technical Analysis: Brent Crude Oil
The move that defines the structure ran from the $79 low on 6 August to $95.30 by 21 August, followed by an abrupt reversal that took price to $84.40 by 25 August. The bounce since has recovered barely two dollars. On the 4-hour chart every moving average now sits above spot, compressed into a narrow band at 89.06, 88.51, 87.97 and 87.43 — the configuration of a market that has changed direction and has not yet stopped falling.
Resistance is the 87.43 lower edge of that band, then 89.06 at its top, with the $92 shelf beyond. Support is the $84.40 reaction low, then $82. The level that invalidates the bearish read is 89.06: reclaiming the whole band would restore the August uptrend and put the mid-nineties back within reach.

WTI reaches $89.43 as Brent clears $95 on renewed supply risk
WTI traded near $89.43 while Brent moved above $95 as Middle East shipping risk lifted crude for a fifth session. Key levels, catalysts and invalidation.

The Day I Stopped Trading and Finally Started Making Money
It was a rainy Tuesday morning, and I was staring at my screen with a familiar knot in my stomach. The previous three days had been a slow, agonizing slide into the red. I had given back two weeks of hard-earned profits in less than seventy-two hours. Every asset I clicked on looked like a […]

Capital Core Verification Process Explained: KYC, Restrictions, and Withdrawal Delays
I learned something the hard way with offshore-style brokers: the smoothest part is usually opening the account, funding it, and placing the first few trades. The real test starts when you try to move money back out. That’s exactly why I wanted to document the Capital Core verification process from a trader’s perspective, not from […]

Bitcoin slips to $65,741 as oil and yields test the breakout
Bitcoin is near $65,741 as rising oil and Treasury yields test the $65.7K breakout floor. Here are the levels that confirm or invalidate the move.

How Liquidity Affects Day Trading Results
When I first started trading day trading, I believed success was all about finding the perfect indicator. I spent weeks testing moving averages, RSI settings, support and resistance levels, and dozens of YouTube strategies that promised easy wins. Some worked for a few trades, but most failed. What confused me was that the same setup […]

The Clock and the Candle: How I Stopped Guessing the Best Time to Trade Day Trading
I still remember the night I blew my third trading account. It was 11:30 PM. The house was completely quiet, the market charts on my screen were barely crawling, and I was forcing trades out of pure impatience. I kept staring at a flatline asset, placing one-minute positions, convinced that the market owed me a […]