Bittensor Reclaims Its 50 Day Line With 266 in Sight
Where the token stands
Bittensor is trading near 206.70 after a long slide from the 539.40 high and a base built around the 140 area. The recovery has been slow rather than explosive, and the token has just edged back above its 50-day average at 203.18. The 200-day average is still well overhead at 233.18, which is the single most important number on this chart.
Momentum has improved to a daily RSI near 58 without stretching into overbought territory. That is the profile of a market repairing itself rather than one racing ahead, and it leaves room for the move to continue if buyers keep showing up.
What the chart is showing
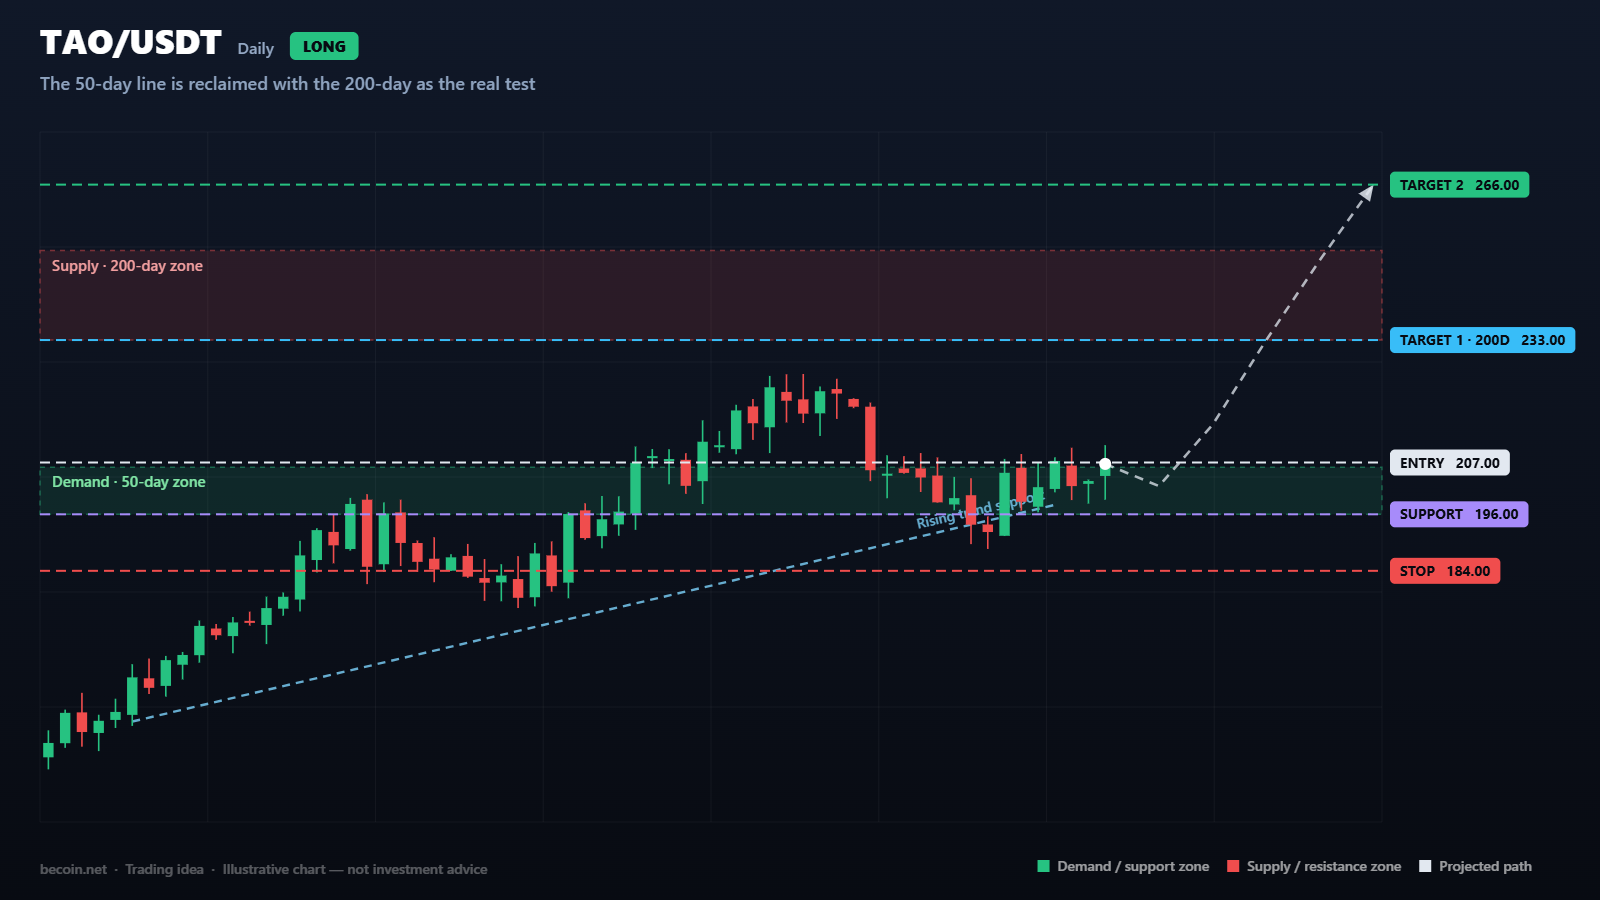
The base near 140 produced a sequence of higher lows, and the line connecting them now runs close to 198. Price has tested that line more than once during the advance and held each time. The 196 to 206 pocket, where the trendline and the 50-day average overlap, has effectively become the demand zone for this recovery.
Above the market, the 233 to 252 band is where the 200-day average sits and where the last meaningful distribution took place. Markets that fail at the 200-day after a deep drawdown often spend weeks chopping beneath it before resolving, so patience around that area is usually rewarded more than aggression.
Levels that matter
Support runs 196 first, then 184 as the invalidation point. The base low at 140 is the deeper reference if the recovery unwinds entirely.
Resistance is 233 at the 200-day, then 266 above it. A daily close above 233 would be the first structural evidence that the downtrend has actually ended rather than paused, and 266 becomes a realistic destination only after that happens.
How the idea could play out
The constructive scenario is that the 196 to 206 demand zone holds, price works through 233, and the move extends toward 266. From current levels with protection below 184, the first target at 233 offers roughly 1.2 times the risk and the second at 266 closer to 2.6 times. The second target carries most of the value, which means this is a trade to hold rather than to scalp.
A more patient version waits for a daily close above 233 and buys the retest. That gives up the first leg entirely but removes the most common failure mode, which is being long into a 200-day rejection.
What would invalidate it
A daily close below 184 breaks the sequence of higher lows and puts the base at 140 back in play. Equally, a sharp rejection at 233 that produces a lower high would suggest the recovery has run its course, even if 184 has not been touched. Both outcomes deserve the same response, which is to step aside and wait.
Managing the position
TAO is a comparatively thin market with wide intraday ranges, and liquidity can disappear quickly during broad crypto selloffs. Stops placed too tightly will be hit by noise; stops placed too widely will hurt. The sensible compromise is a wider stop with smaller size rather than the reverse.
Taking partial profit into the 200-day average and moving the remaining stop to break-even removes the scenario where a well-timed entry ends up as a losing trade.
The bottom line
Bittensor has done the easy part of a recovery: it has stopped falling and reclaimed a short-term average. The hard part sits at 233. Until that level is dealt with, this is a base-building story with a defined risk, not a trend to chase.
Becoin.net Premium Analysis - Becoin.net Tariff Plan
This analysis is a technical study prepared for educational purposes. It is not investment advice, and no outcome described here is guaranteed. Trade only with capital you can afford to lose.

The Day I Stopped Trading and Finally Started Making Money
It was a rainy Tuesday morning, and I was staring at my screen with a familiar knot in my stomach. The previous three days had been a slow, agonizing slide into the red. I had given back two weeks of hard-earned profits in less than seventy-two hours. Every asset I clicked on looked like a […]

WTI reaches $89.43 as Brent clears $95 on renewed supply risk
WTI traded near $89.43 while Brent moved above $95 as Middle East shipping risk lifted crude for a fifth session. Key levels, catalysts and invalidation.

Bitcoin slips to $65,741 as oil and yields test the breakout
Bitcoin is near $65,741 as rising oil and Treasury yields test the $65.7K breakout floor. Here are the levels that confirm or invalidate the move.

Trading Currency Strength Instead of Single Pairs
It was a Tuesday afternoon when I realized I was fighting a losing battle against a ghost. My screen was a chaotic web of indicators. I had the EUR/USD chart open, a moving average crossing over here, a relative strength index flashing oversold there, and a price action setup that looked textbook perfect. I clicked […]

How Liquidity Affects Day Trading Results
When I first started trading day trading, I believed success was all about finding the perfect indicator. I spent weeks testing moving averages, RSI settings, support and resistance levels, and dozens of YouTube strategies that promised easy wins. Some worked for a few trades, but most failed. What confused me was that the same setup […]

Which Broker Has Better Risk Management Tools?
The burning smell of my own account blowing up is a scent I will never forget. It was a rainy Tuesday afternoon a few years back. I sat huddled over my laptop, watching a currency pair oscillate. Confident, arrogant, and entirely unprotected, I clicked buy. Minutes later, a sudden market spike completely wiped out my […]