
Bitcoin Range Analysis: How to Read Highs, Lows and Mid-Range
A Bitcoin range is the zone between a repeatedly defended low and a repeatedly rejected high. The midpoint helps show which side has short-term control, but it is not a trade signal by itself. A useful range analysis marks the boundaries, waits for price to react, and defines invalidation before entry.
This guide uses Shahwaiz Khan’s 21 July 2026 charts as dated examples. They explain the method; they are not live levels or current trade calls.
The three levels that define a Bitcoin range
| Zone | What it represents | Constructive evidence | Failure evidence |
|---|---|---|---|
| Range low | Area where buyers previously absorbed selling | Sweep below the low followed by a close back inside; higher low; expanding demand | Acceptance below the low and a failed retest from underneath |
| Mid-range | Halfway point between the chosen high and low | Reclaim, hold and successful retest | Repeated rejection or a quick loss after the reclaim |
| Range high | Area where sellers previously capped advances | Close above the high, follow-through and a held retest | Wick above the high followed by a close back inside |
The midpoint is calculated as (range high + range low) ÷ 2. Its value depends entirely on choosing meaningful boundaries. If a trader redraws the range after every small candle, the midpoint becomes noise rather than a consistent reference.
Start with the higher-time-frame structure
A lower-time-frame range should be interpreted inside the daily or weekly structure. First ask whether Bitcoin is making higher highs and higher lows, lower highs and lower lows, or overlapping swings without a clear trend. That context changes what a breakout would mean.
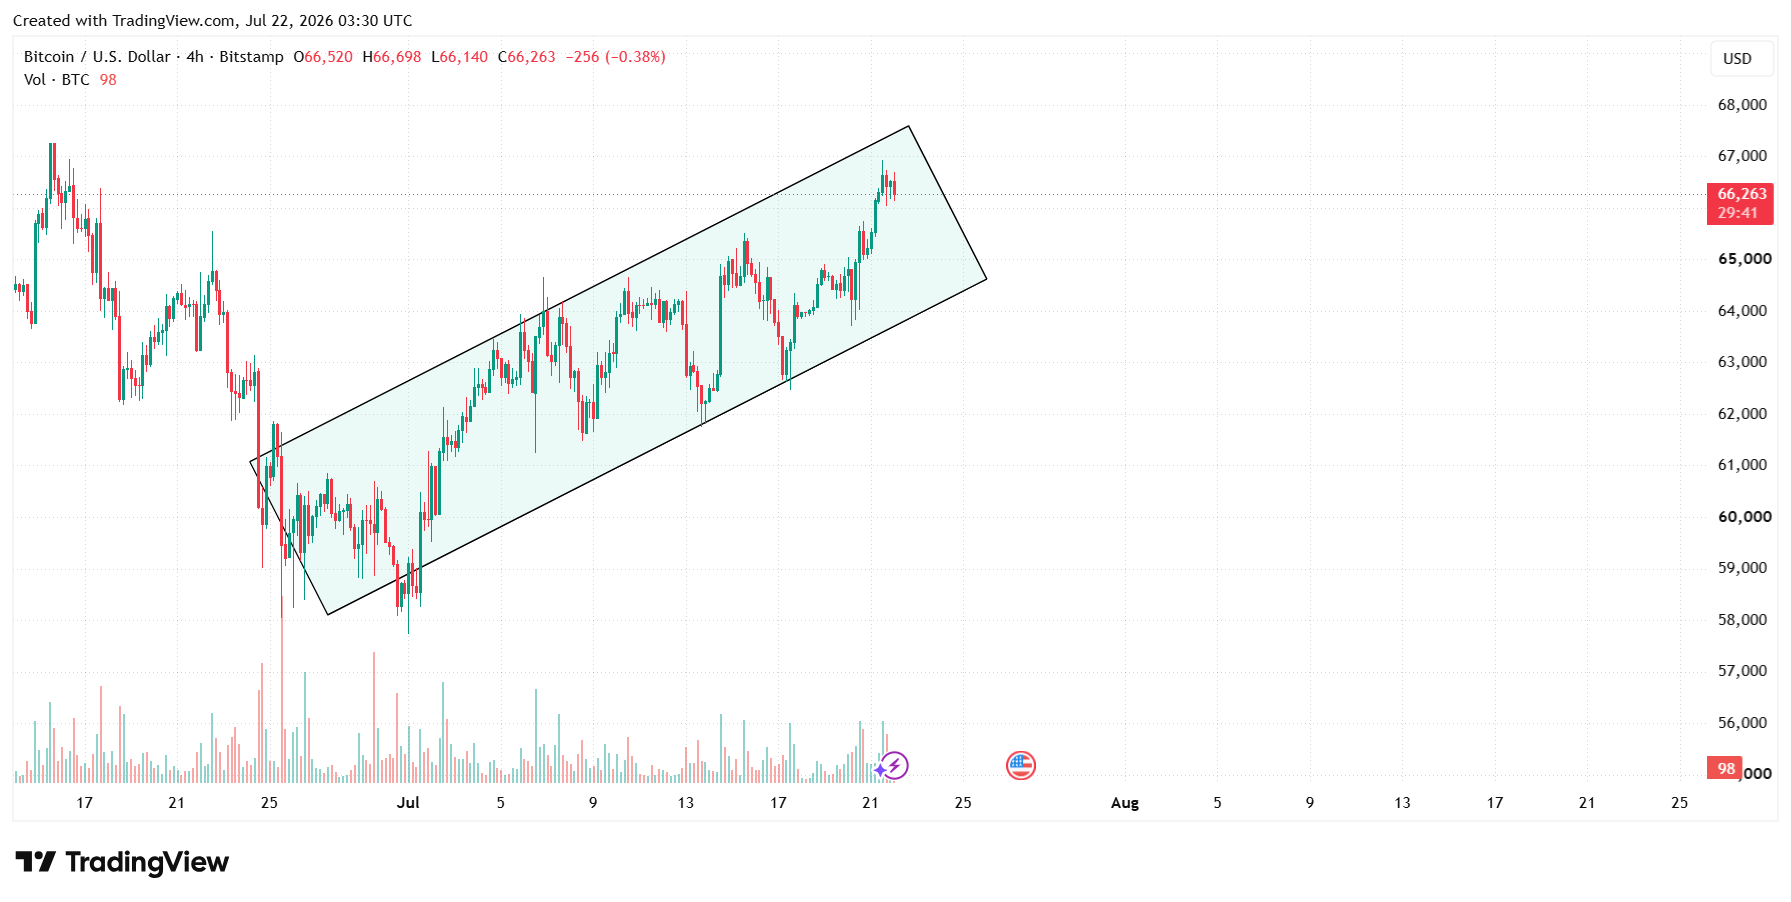
Higher time frames reduce the influence of individual candles, but they do not make an outcome certain. A bullish broader structure can still suffer a failed breakout or a deep retracement. Use the larger trend as context, not as permission to ignore risk.
Map the range before deciding what to do
Choose a high and low that price has tested or reacted to more than once. Then mark the midpoint. The cleanest range map is usually the one that explains the most repeated reactions with the fewest lines.
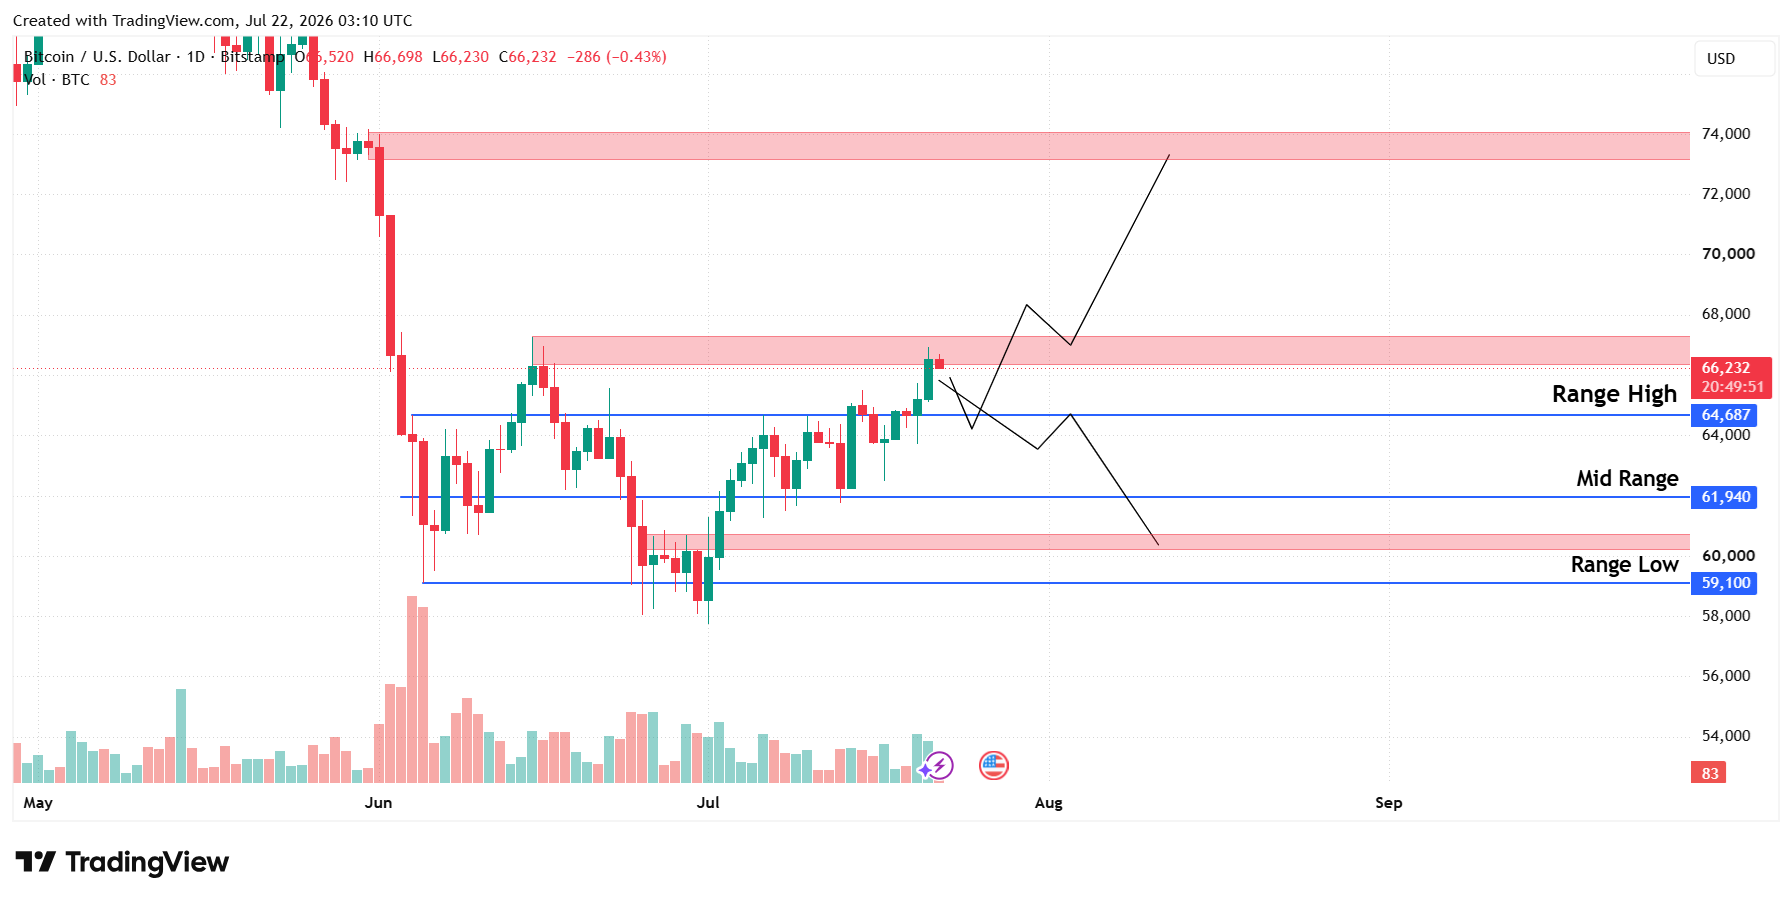
A common mistake is entering near the middle simply because price is moving. The middle often offers less distance to either boundary and a weaker risk-to-reward profile. The better question is not “Is Bitcoin going up now?” but “Where is the idea invalid, and is the remaining distance to the target worth the risk?”
Reclaim, rejection and acceptance are different
- Reclaim: price moves back above a level after trading below it.
- Rejection: price tests a level but cannot sustain trade beyond it.
- Acceptance: several closes or a sustained period of trade hold beyond the level, ideally followed by a successful retest.
One wick is weak evidence. A close beyond the level is stronger, but follow-through and a retest provide more information. No confirmation method eliminates false breakouts; the purpose is to define what evidence would change the range thesis.
How to read a liquidity sweep
Orders often cluster around obvious prior highs and lows. Price may trade briefly through a boundary, trigger stops or breakout orders, and then return to the range. Traders commonly call this a liquidity sweep or false breakout.
A sweep is not automatically a reversal. Look for a close back inside the range, a failed attempt to break the swept extreme again, and a logical invalidation point. If price remains outside and the old boundary holds on retest, the move may be genuine acceptance rather than a trap.
Use USDT dominance as context—not confirmation
USDT dominance (USDT.D) measures Tether’s share of the total crypto market capitalization. Traders sometimes watch it as a rough risk-appetite context: a rising share can coincide with capital moving toward stablecoins, while a falling share can coincide with capital moving toward crypto assets. The relationship is not one-to-one and should not replace Bitcoin’s own price structure.
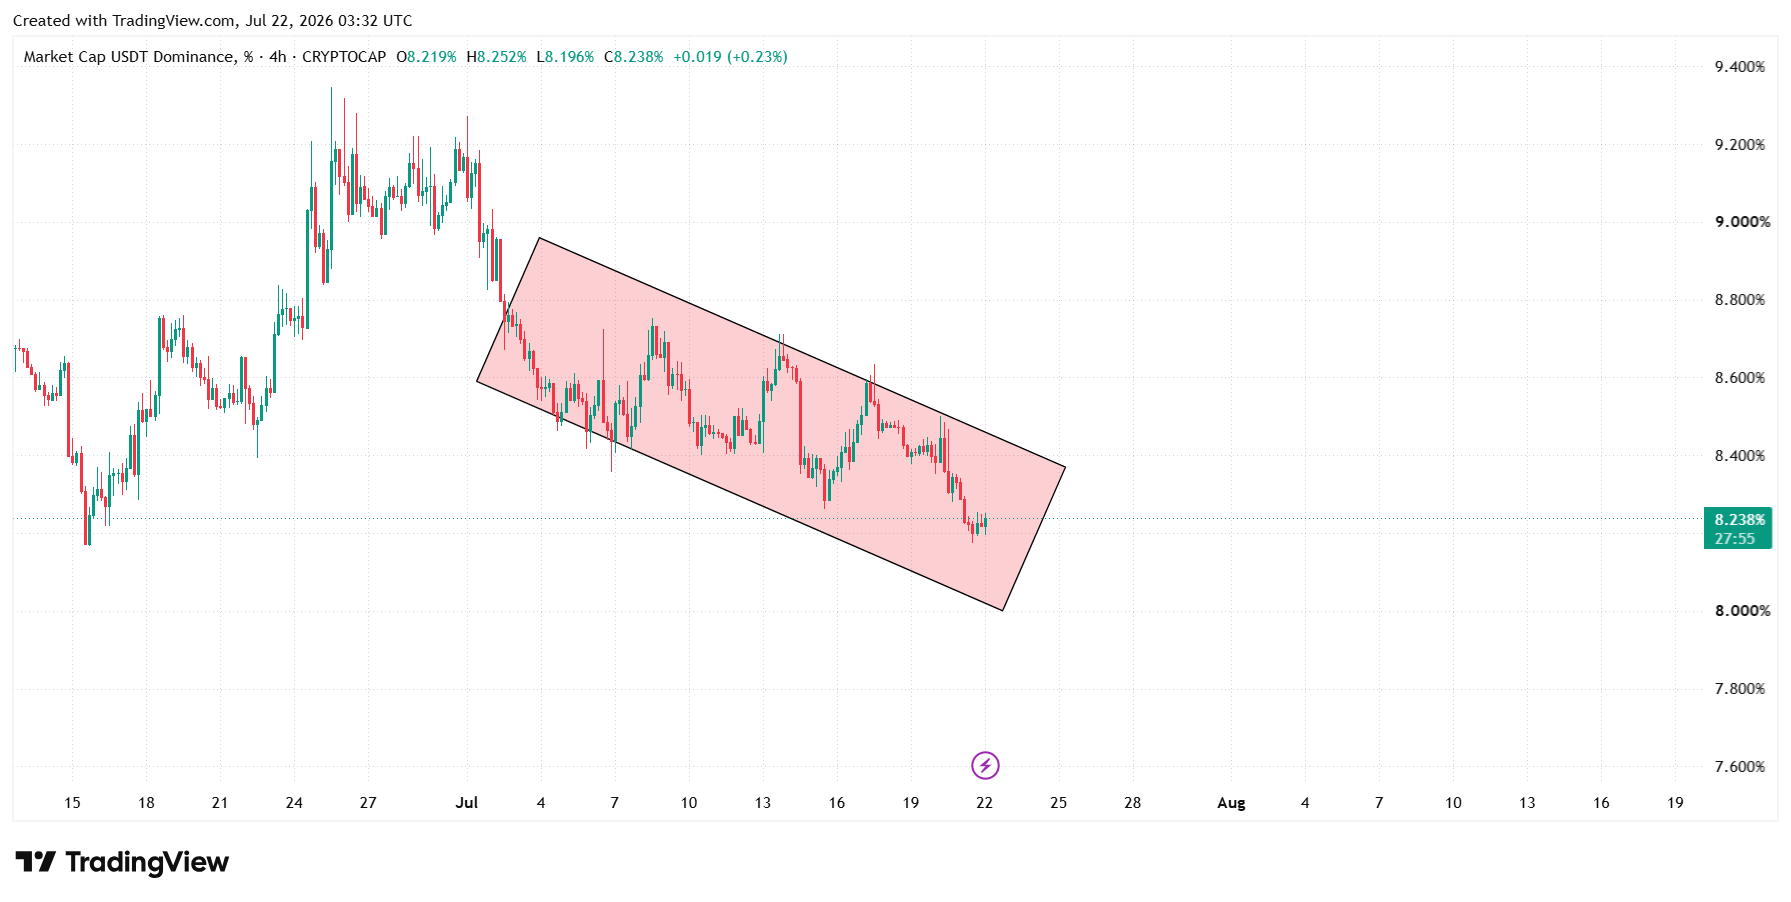
If Bitcoin is testing a range high while USDT dominance is also breaking higher, the signals conflict and caution may be appropriate. If Bitcoin reclaims its midpoint while USDT dominance weakens, the two observations are more aligned. In either case, define the Bitcoin invalidation first.
A practical range-analysis checklist
- Choose the daily or weekly market structure before zooming in.
- Mark a repeatedly tested range high and range low.
- Calculate the midpoint and avoid redrawing it to fit a preferred view.
- Write down the evidence required for a reclaim, rejection or breakout.
- Set invalidation before entry and size the position for that distance.
- Use secondary context such as volume or USDT dominance only after price structure.
- Reassess when price accepts outside the range; do not defend a broken thesis.
Practice this process without financial risk in BeCoin’s trading simulator, compare it with the current Bitcoin forecast, and review the evidence on day-trading success rates.
Frequently asked questions
What is a Bitcoin trading range?
It is a period in which price repeatedly trades between a recognizable support area and resistance area without sustained acceptance beyond either boundary.
How do I calculate the range midpoint?
Add the selected range high and range low, then divide by two. The result is only useful when the chosen boundaries reflect repeated market reactions.
Does a move above the range high confirm a breakout?
Not by itself. A close, follow-through and a held retest provide stronger evidence than a brief wick above the high.
Is USDT dominance a buy or sell signal for Bitcoin?
No. It is secondary context for crypto risk appetite. Bitcoin’s own structure, invalidation and position risk should come first.
Methodology and sources
This article preserves Shahwaiz Khan’s three original chart examples and rewrites the analysis as an evergreen method. The images were captured on 21 July 2026, so no price shown in them is presented as current. The framework defines its terms, separates primary price structure from secondary context, and avoids claiming that any pattern predicts an outcome.
Educational references: CME Group’s technical-analysis course for chart, trend, support and resistance concepts; and the CFTC’s virtual-currency trading risk advisory for volatility, platform and customer-protection risks. Sources reviewed 23 July 2026.
Get full access to all 100+ assets →
This article is for education and information only. It is not financial or investment advice. Crypto assets are highly volatile, technical analysis can fail, and losses can exceed expectations. Verify live prices and consider your financial situation before acting.

Bitcoin slips to $65,741 as oil and yields test the breakout
Bitcoin is near $65,741 as rising oil and Treasury yields test the $65.7K breakout floor. Here are the levels that confirm or invalidate the move.

How Many People Own Bitcoin? (2026 Data, Charts & Country Breakdown)
About 365 million people owned Bitcoin in 2025 - roughly 4-4.5% of the world and nearly half of all crypto owners. See the year-by-year growth curve, country data, whole-coin rarity, and why estimates disagree.

Can You Start Trading with $10 on Deriv?
A lot of beginners enter trading with the same question: “Is $10 actually enough to start trading on Deriv?” The short answer is yes. But the real answer is more complicated. You can start with $10 on Deriv, but whether you can survive, learn, and grow that account depends entirely on your expectations, discipline, and […]

Best Broker for Pakistani Traders in 2026
Finding the best broker in Pakistan is not as simple as choosing the platform with the biggest ads or the highest payout percentage. Pakistani traders face unique challenges including payment method limitations, withdrawal delays, unstable strategies, and brokers that look attractive at first but become difficult to use later. Many beginners deposit money into the […]

How Much Money Do You Really Need to Start Trading? A Realistic Beginner’s Guide for 2026
One of the most common questions beginners ask is: How much money do I need to start trading? It sounds like a simple question, but the answer depends on what you actually mean by start trading. Are you trying to learn? Are you hoping to grow savings over time? Are you trying to create a […]

Why 90% of Traders Lose Money (Real Reasons Beginners Don’t Realize)
Most Traders Don’t Lose Because of Strategy — They Lose Because of Behavior If you ask most beginners why traders fail, you’ll hear answers like: But after observing thousands of beginner trading behaviors, the truth is much simpler and more uncomfortable: “Most traders lose money because of how they behave, not what they use.” Even […]