Pocket Option Candlestick Patterns: The Key to Better Trades
I’ll never forget the first time I stared at a Pocket Option chart, clueless about what all those candlesticks meant. It looked like a strange language, green and red bars moving up and down without warning. I took a few trades based on gut feeling.
Spoiler: I lost.
That’s when I realized I needed to learn candlestick patterns. Not just memorize them, but understand what they mean. And once I did, everything changed. My win rate improved. My confidence soared. No more second-guessing. Now I will show you the exact candlestick patterns that helped me level up on Pocket Option.
Want to test these patterns risk-free?
Open your free Pocket Option demo account and get $10,000 in virtual funds. It’s the easiest way to learn candlestick trading before going live, no deposit required.
These aren’t just textbook definitions. I’ll walk you through how each plays out in real trades and what to watch for. Finally, I’ve included a downloadable cheat sheet you can use as a quick visual guide during live trading.
Let’s start with the candlestick basics; then dive into the patterns.
Why Candlestick Patterns Matter on Pocket Option
Unlike longer-term trading, binary options give you just seconds or minutes to decide. So patterns that give you even a slight edge matter a lot. Candlesticks show real-time price psychology. They reveal who’s in control, the buyers or the sellers, and what might happen next.
But here’s what most articles don’t tell you: not every pattern is reliable on lower timeframes. Some only work in strong trends. Others are better at reversals. That’s where experience and context come in.
I’m going to share the nine patterns I trust the most for fast Pocket Option trades. Let’s go.
1. The Pin Bar (Also known as the Hammer or Shooting Star)
This was the first candlestick that actually made me money. Picture this: I was trading EUR/USD on the 30-second chart. The market had been dropping fast. Then, out of nowhere, a tiny-bodied candle with a long lower wick formed at a support level. That was the hammer.
It meant sellers tried to push lower, but buyers snapped back firmly. I entered a quick BUY trade. Thirty seconds later, it closed in on the money.
Pin Bars show rejection. Use them at key levels or after sharp moves. They work best when:
- The wick is 2–3 times longer than the body
- The candle forms at a previous support/resistance level
- There’s a strong reaction after it closes
2. Engulfing Pattern (Bullish & Bearish)
If you only learn one pattern, let it be this. I remember spotting a bullish engulfing candle during a news spike. A green one completely swallowed the previous red candle. I placed a BUY just after it closed. That trade paid for my lunch and dinner.
Engulfing patterns are powerful reversal signals. Here’s what to look for:
- A small candle followed by a larger one of the opposite color
- The second candle “engulfs” the first entirely
- Stronger when formed after a long move
Don’t trust them in choppy markets. Wait for clear direction.
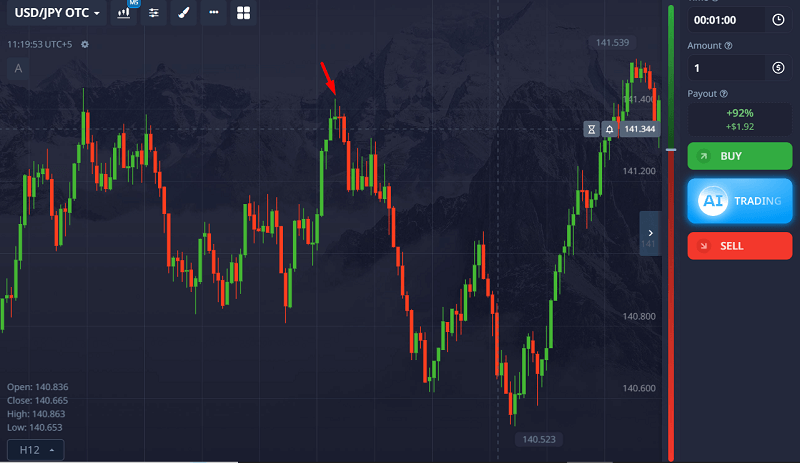
3. Doji
Dojis used to confuse me. They don’t look like much, just a cross or thin-bodied candle. But their power is in their indecision.
I once saw a doji form after five straight green candles on USD/JPY. That was the signal to watch out for. A bearish candle followed, and I jumped in with a PUT.
Here’s when to use Doji:
- After a strong trend (potential reversal)
- At significant resistance or support
- Only when followed by confirmation (like an engulfing or strong opposite candle)
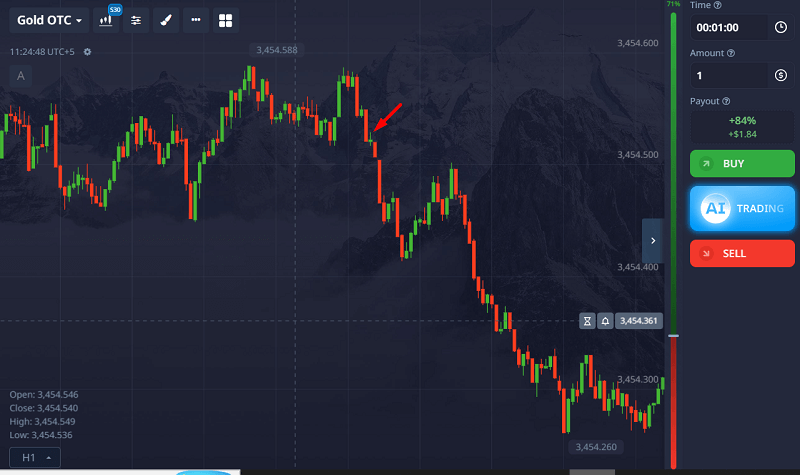
4. Morning Star & Evening Star
These are 3-candle patterns that show major shifts. They take patience to spot but pay off big.
The Morning Star saved me once when trading Gold. Price had been dumping, and I was tempted to short again. But then: green candle → small-bodied candle → strong red candle. I entered a SELL and it shot up.
How to spot them:
- Morning Star: Red → Small candle → Green
- Evening Star: Green → Small candle → Red
- Look for the middle candle to “gap” slightly and be small
- Best on 1-min or 2-min timeframes
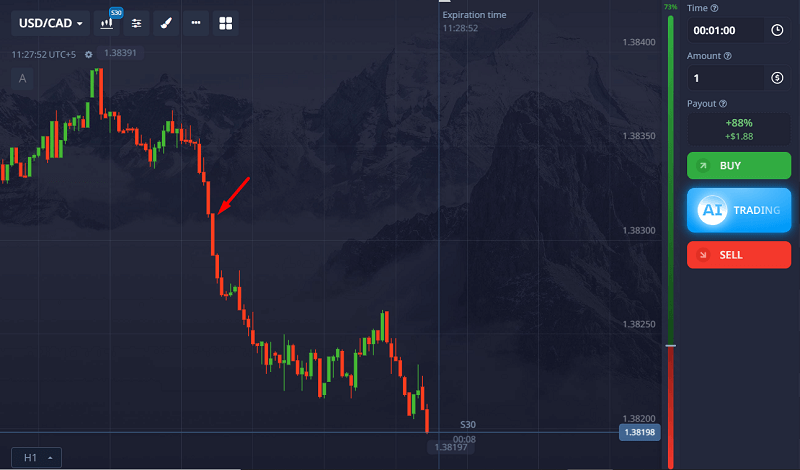
5. Three White Soldiers & Three Black Crows
These patterns scream momentum. Buyers are in charge when you see three strong green candles in a row (White Soldiers). Three strong red ones (Black Crows)? Get ready for more downside.
I often use this to catch a second or third wave of a trend. For example, on a USD/CAD rally, I saw three white soldiers form and waited for a slight pullback before hitting a CALL. It was a clean win.
Watch for:
- Similar-sized candles
- Small or no wicks
- Trend continuation rather than reversal
You can use this as a one-minute strategy as well.
Ready to apply these patterns in real trades?
Get a 50% bonus on your first Pocket Option deposit and start practicing with a solid plan. Combine this with our candlestick cheat sheet for better setups and stronger signals.
6. Tweezer Tops & Bottoms
These are subtle but deadly accurate when used correctly. I like them for scalping reversals on short-term charts.
A Tweezer Top is two candles with equal highs, usually after an uptrend. Tweezer Bottom? Equal lows after a drop.
Once, I caught a perfect Tweezer Bottom on EUR/GBP with both candles having matching wicks. I waited for a small green candle to confirm, and the price bounced.
Ideal setup:
- Two or more candles with matching highs/lows
- Wick rejection is key
- Works best with RSI/MACD divergence
7. Marubozu
This one has no wick. Just a solid block. When you see it, take notice.
A green Marubozu shows strong buying, no hesitation. Red means heavy selling. I used to fade these, thinking they were “too late” to trade. Wrong. Often, they start a bigger move.
Now, I either ride the momentum, wait for a tiny pullback, and then enter. This strategy is especially powerful after news events.
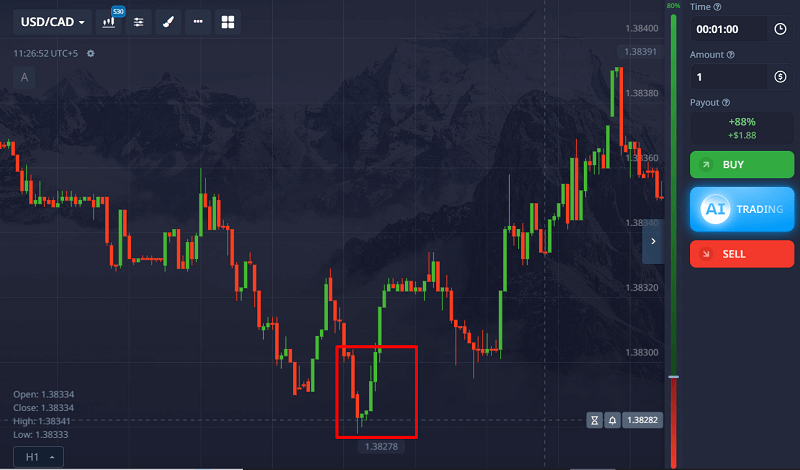
8. Inside Bar
The Inside Bar tells you a big move is coming. It’s a pause before the storm.
This works best on 1 to 5 minute charts. When I spot one, I draw a mini box around it and wait for a breakout. If the following candle breaks above, I will call. If it breaks below, I put.
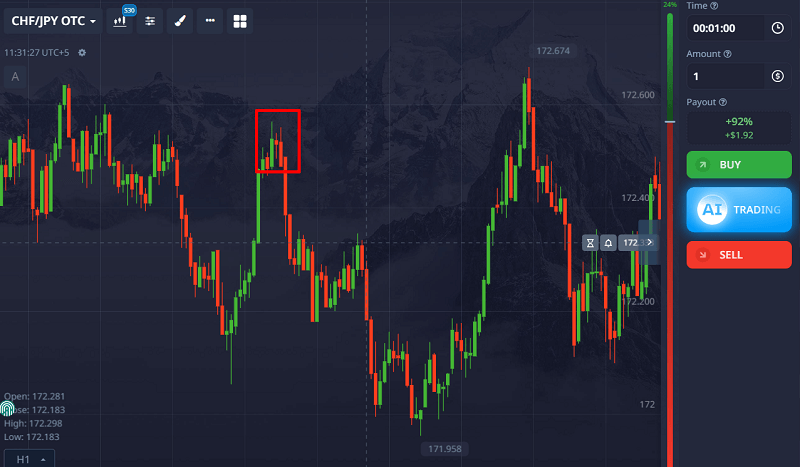
Tips:
- Inside Bar is smaller and fits within the high/low of the previous candle
- Works well after strong moves or at key levels
- Avoid sideways markets
9. The Fakeout Wick
Okay, this one’s not in most guides, but it should be. I call it the “fakeout wick.” You’ll see a long wick pierce a level and then snap back. It looks like a breakout, but it’s a trap.
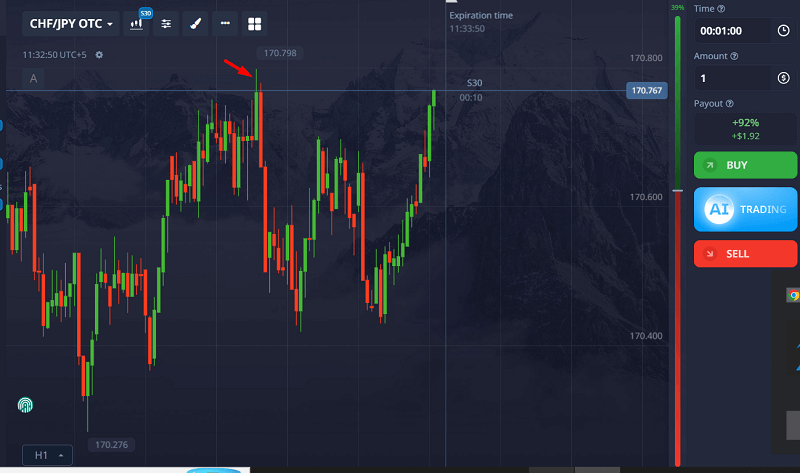
I’ve been caught in a few. But now I use it to my advantage. When I see a long wick that breaks a level but fails, I enter in the opposite direction, right after a confirmation candle.
Look for:
- Wick is at least 2x body length
- Price quickly reverses
- Works at daily highs/lows or psychological levels
Combining Candlestick Patterns with Chart Structure
Although this guide focuses on candlestick patterns, structure still matters.
For example, a W pattern (double bottom) is technically a chart pattern. But the entry trigger often comes from a candlestick confirmation, such as a bullish engulfing or hammer at the neckline.
This is how professional traders combine price structure with candle psychology rather than relying on shapes alone.
If you want to apply this properly, practice identifying both structure and candle confirmation together.
👉 Open your Pocket Option account and test these confirmations live
Real Market Examples
I’ve logged over 200 trades using these patterns. Here are a few standout ones:
- EUR/USD 1-min chart: Tweezer Bottom at round number 1.0900 followed by engulfing green candle. CALL trade = ITM.
- GBP/JPY 2-min chart: Evening Star after news spike. PUT trade = ITM.
- Gold 30s chart: Fakeout Wick above previous high, snapped back. PUT trade = ITM.
Best Candlestick Patterns for Pocket Option Scalping
For 30-second and 1-minute trades, not every pattern performs equally.
Engulfing candles at key levels, strong pin bars, and clear momentum Marubozu candles tend to work best in fast conditions. However, market context matters more than the pattern itself.
Sideways markets reduce reliability. Strong trends increase it.
If you’re trading very short expiries, reduce noise by:
- Waiting for candle close
- Trading at clear levels
- Avoiding overtrading
Consistency comes from patience, not frequency.
Candlestick Patterns Ranked by Reliability (Pocket Option)
The reliability of a candlestick pattern depends heavily on context, timeframe, and market conditions. However, based on short-term binary trading behavior (1–5 minute charts), here’s how they generally rank when used correctly.
| Rank | Pattern | Pattern Type | Market Signal | Reliability (Short-Term) | Best Used In |
|---|---|---|---|---|---|
| 1 | Engulfing (Bullish/Bearish) | Reversal / Continuation | Momentum Shift | ⭐⭐⭐⭐⭐ High | Pullbacks in strong trends |
| 2 | Pin Bar (Hammer / Shooting Star) | Reversal | Rejection at Key Level | ⭐⭐⭐⭐ High | Support & Resistance zones |
| 3 | Morning Star / Evening Star | Reversal (3-candle) | Trend Exhaustion | ⭐⭐⭐⭐ High | After extended moves |
| 4 | Marubozu | Continuation / Breakout | Strong Conviction | ⭐⭐⭐ Medium-High | Breakouts & momentum trades |
| 5 | Double Wick Rejection | Reversal | Level Exhaustion | ⭐⭐⭐ Medium | Range boundaries |
| 6 | Inside Bar | Consolidation / Breakout | Volatility Compression | ⭐⭐ Medium | Trend continuation setups |
| 7 | Doji | Indecision | Momentum Pause | ⭐ Low (needs confirmation) | Early reversal warning |
Common Mistakes Traders Make
Many traders lose not because patterns fail, but because they misuse them. The most frequent problems include trading without context, entering before candle closure, and forcing setups in ranging markets.
Another mistake is constantly switching strategies. Mastering two or three patterns deeply produces better results than chasing dozens.
Final Thoughts
I’m not saying candlestick patterns are magic. You still need risk management, timing, and practice. But they gave me clarity when I was drowning in confusion.
Use them with trendlines, support/resistance, and a simple indicator like RSI. Start slow. Focus on 1 or 2 patterns first. And always test them in a demo before going live.
Because in binary options, seconds matter. And when you recognize what price is saying through candlesticks, you trade smarter, not harder.
Want to master candlestick trading on Pocket Option?
Start with the demo account here and when you’re ready, claim your 50% deposit bonus to begin live trading with a head start. Learn smarter. Trade better.
FAQs
What are the best candlestick patterns for Pocket Option?
The most reliable ones include Pin Bars, Engulfing, Morning/Evening Star, and Tweezer Tops/Bottoms. Use them with context and confirmation.
Do candlestick patterns work on 30-second charts?
Yes, but only the stronger ones like Engulfing, Pin Bars, and Marubozu. Look for confluence and volume.
How can I quickly learn candlestick patterns?
Use visual cheat sheets and replay your trades. Focus on 1-2 patterns a week. Practice on the demo and take screenshots.
Can I use indicators with candlestick patterns?
Absolutely. Try combining RSI or MACD with patterns for more accurate entries.
When do candlestick patterns fail?
They often fail in sideways or low-volume markets and when used without context, such as support/resistance or trend.

ExpertOption Web vs Mobile vs Desktop App: My Real Trading Experience Across All Three
When I first began comparing ExpertOption Web vs Mobile vs Desktop App, I wasn’t thinking about performance optimization or psychological discipline. I simply wanted to place trades. Over time, I realized something important: the platform I used influenced my timing, my patience, and even my win rate. That discovery didn’t come from reading reviews. It
Binomo Bonus Terms Explained: When a Deposit Bonus Can Delay or Block Your Withdrawal
The first time I accepted a bonus on Binomo, I thought I was making a smart move. I had just made a small deposit, saw the extra balance appear, and immediately felt more confident. More funds meant more trades, more flexibility, and maybe faster progress. At least that’s how it looked on the screen. What
Binomo Withdrawal Pending: Real Reasons, Timelines, and What to Do at Each Hour Mark
The first time I saw Binomo withdrawal pending on my screen, I stopped caring about my trades for the day. Not because the amount was huge. It wasn’t. What bothered me was the uncertainty. When you trade on a platform like Binomo, the real test isn’t the deposit button. It’s the withdrawal button. Depositing is
Decision Fatigue: Why Too Many Trades Kill Your Accuracy
I didn’t learn about decision fatigue from a book or a psychology blog. I learned it on the charts, the hard way, on days when I walked in feeling sharp and walked out confused about how my accuracy fell apart without warning. It wasn’t the market. It wasn’t the strategy. It was me reaching a
Binomo Demo vs Real Account: What Changes After You Deposit (KYC, Payout, Support, Limits)
I spent far too long thinking my Binomo demo results meant I was “ready.” On demo, everything felt clean. My entries looked sharp. My timing looked better than it probably was. I could reset virtual balance, test ideas, and convince myself I had control. Then I made my first real deposit, and that’s when I
Binomo Deposit/Withdrawal: Why Using Different Payment Methods Causes Delays
The first time I hit a decent withdrawal on Binomo, I thought the hard part was over. I had done the trades. I had managed the risk better than usual. I had finally resisted the urge to overtrade after a win streak. So when I clicked withdraw, I expected the money to move as smoothly