Pocket Option Indicators & Signals: How to Trade Smarter

Hey there! If you’ve ever stared at the Pocket Option chart wondering what now? Trust me, you’re not alone. I’ve been there. I still remember my early trades, full of nerves and random clicks, hoping something would work. Spoiler: it didn’t.
However, once I understood how to use indicators properly, everything changed.
This guide is not your usual boring theory dump. I’ll walk you through my favorite indicators, how I use them in real trades, the exact settings that work for different strategies and I’ll also answer the questions you won’t find on Google. Ready? Let’s go.
Why Indicators Matter on Pocket Option
Before we jump into the top indicators, let’s get one thing clear. Indicators don’t predict the market. They’re tools just like your GPS. They help you make informed decisions. Without them, you’re basically trading blind.
Ready to Try These Indicators on a Real Chart?
Open a Pocket Option account today and get a 50% deposit bonus as a new trader. It’s the perfect way to practice what you’re learning—risk-managed, with more capital to grow.
Sign up here with my bonus link and start trading smarter from day one.
On Pocket Option, where trades move fast and timing is everything, the right indicator can be the difference between a winning session and a blown account.
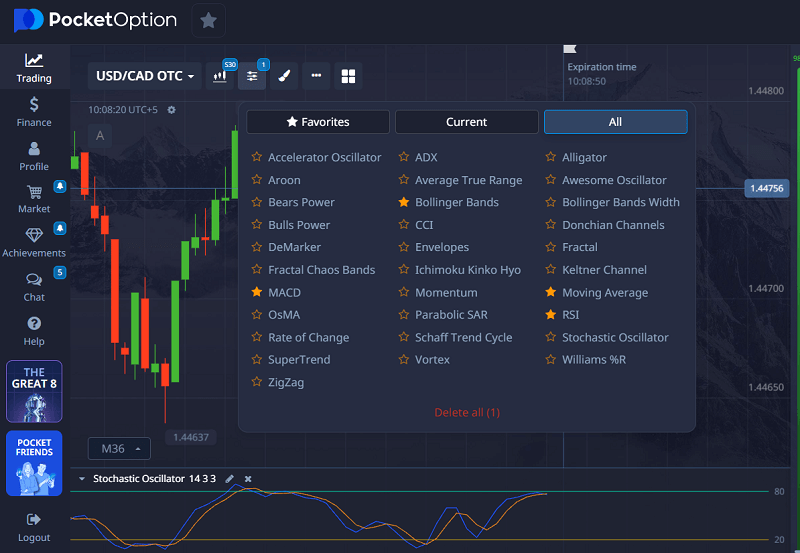
My Top 5 Best Indicators for Pocket Option
These are the ones that I use regularly and have tested over dozens (okay, hundreds) of trades.
1. RSI (Relative Strength Index)
RSI is like a mood detector. It tells me if the market is tired from buying or selling too much.
- How I use it:I look for RSI crossing over 70 (overbought) or under 30 (oversold). That usually hints a reversal is coming.
- My favorite setting:14-period RSI with an extra twist. I combine it with a 5-period RSI. This helps catch sharp momentum shifts for short-term trades.
- Best strategy combo:RSI + candlestick reversal patterns (like pin bars) = gold for 1–5 minute trades.
Read more about step by step using Pocket Option.
2. MACD (Moving Average Convergence Divergence)
MACD shows the tug-of-war between bulls and bears. It’s great for spotting momentum and trend changes.
- How I use it:I wait for the MACD line to cross the signal line. If it crosses from below, I prepare for a buy. If it crosses from above, I look to sell.
- My favorite setting:12, 26, 9 (classic). But for scalping? I tweak it to 5, 13, 1. It makes MACD more responsive.
- Bonus tip:If MACD crosses and RSI confirms the direction? That’s a high-conviction trade.
3. Bollinger Bands
I call these my “price cages.” They help spot volatility and breakout opportunities.
- How I use it:When the price touches the upper or lower band, I zoom in. If the candle is rejecting the band (e.g., wicks), I prepare for a reversal.
- My favorite setting:20-period with 2 standard deviations. For high-volatility assets, I adjust to 1.8.
- Secret sauce:Combine Bollinger Bands with RSI divergence. If the price hits the upper band and the RSI shows a bearish divergence? I’m in.
4. Stochastic Oscillator
It’s RSI on steroids. It’s more sensitive, which is great for quick trades.
- How I use it:When %K crosses %D in overbought/oversold areas, I jump in for 1-minute trades.
- Settings I use:5, 3, 3 works great for short-term action.
- Best combo:I use Stochastic + Support/Resistance zones. Works like magic on ranging markets.
5. Moving Averages (SMA & EMA)
These are the backbone of any trend-following system.
- How I use them:I use 50 EMA and 200 EMA for trend direction. A golden cross (50 crossing above 200) = bullish. Death cross = bearish.
- Settings I tweak for scalping:EMA 9 and EMA 21 on a 15s or 30s chart. Super sharp entries.
- Killer trick:Add a moving average cloud (like 9, 21, and 50 EMA) for clean trend visualization.
You’ve Seen the Strategies. Now It’s Your Turn.
Theory is nice, but nothing beats real practice. Use my custom indicator setups on Pocket Option and get a 50% bonus on your first deposit when you register through this link.
✅ Fast execution
✅ User-friendly charts
✅ Trusted payout system
Claim your bonus and open an account now
Real Trade Examples: How Signals Helped Me Win
Let me walk you through a few trades where these indicators saved my skin or helped me bank some quick profits.
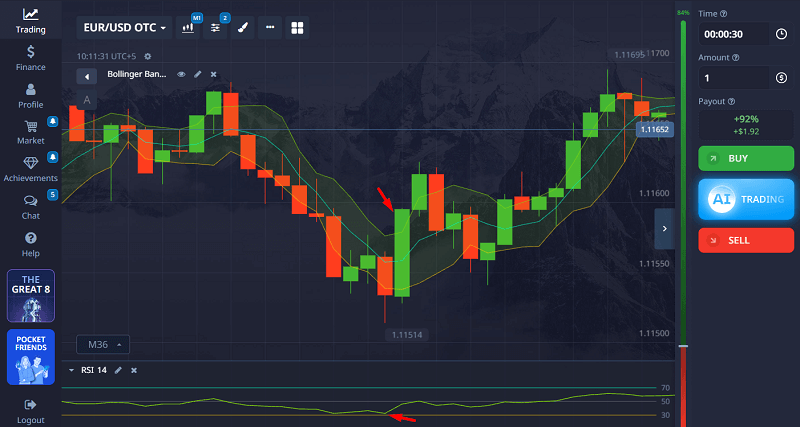
Trade #1: EUR/USD Reversal (RSI + Bollinger Bands)
- Timeframe: 1 minute
- Setup: RSI dropped below 30, and the price touched the lower Bollinger Band.
- Signal: RSI divergence showed price wasn’t dropping as hard.
- Entry: Bullish engulfing candle formed.
- Result: 3 ITM trades back to back.
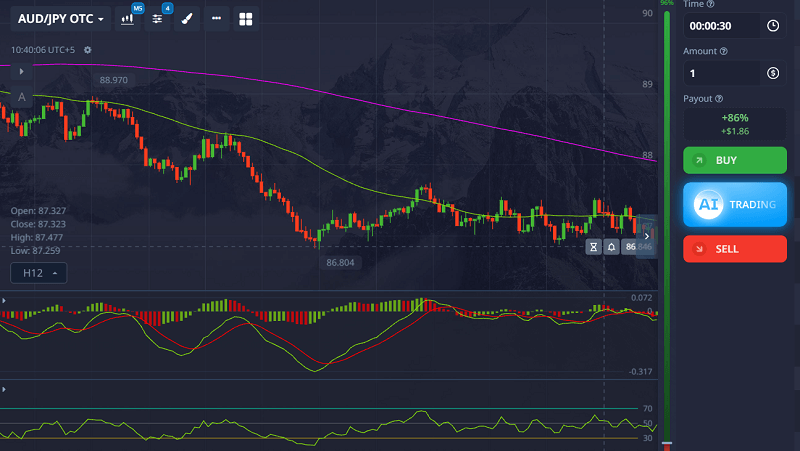
Trade #2: Trend Following with MACD (AUD/JPY)
- Timeframe: 5 minutes
- Setup: MACD line crossed above the signal line. RSI was at 50 (neutral but rising).
- Signal: Price broke below 200 EMA.
- Entry: On pullback to 50 EMA.
- Result: 86% payout within 5 minutes.
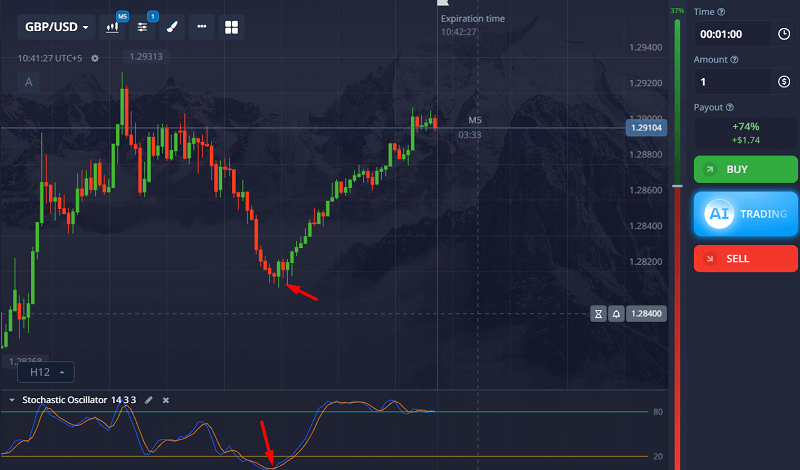
Trade #3: Stochastic + Support Zone (GBP/USD)
- Timeframe: 30 seconds
- Setup: Price was bouncing between clear support/resistance.
- Signal: Stochastic crossed upward from oversold + support bounce.
- Entry: Instant high.
- Result: Quick win in under 1 minute.
Ideal Indicator Settings Based on Strategies
Let’s be real, there’s no “one size fits all.” So here’s what I recommend depending on how you like to trade:
| Strategy Type | Timeframe | Indicators | Settings |
| Scalping | 15s – 1 min | RSI, Stochastic, EMA | RSI (5 & 14), Stochastic (5,3,3), EMA (9 & 21) |
| Trend Following | 5–15 min | MACD, Moving Averages | MACD (12,26,9), EMA (50,200) |
| Reversal Hunting | 1–3 min | RSI, Bollinger Bands, Stochastic | RSI (14), BB (20,2), Stoch (5,3,3) |
| Range Trading | 30s – 5 min | RSI, Stochastic, S/R Zones | RSI (14), Stoch (5,3,3) |
Trade Smarter, Not Harder – with a Bonus Boost
If you’re serious about applying these setups, don’t wait. Pocket Option makes it simple to execute these trades, and when you sign up through my link, you’ll receive an exclusive 50% deposit bonus to kickstart your trading journey.
🎯 Start with proven tools.
💸 Get more from every trade.
Join Pocket Option today and get your bonus
FAQs
Can I use multiple indicators at once?
Yes, but don’t overdo it. I stick to 2–3 max. More than that, and you’ll freeze up with “analysis paralysis.”
What indicators work best for OTC trading on weekends?
OTC is tricky. I’ve found RSI and Bollinger Bands work best. Add candlestick confirmation, and you’re good.
Which indicators repaint or lag?
- RSI, MACD, and Bollinger Bands don’t repaint.
- Be cautious with some custom signals or indicators labeled “fast”. They often repaint.
Why do my trades go wrong even with correct signals?
Great question. A few reasons:
- Bad entry timing: Wait for the candle to close.
- Ignoring news: Big events can kill your setups.
- Forcing trades: Only trade when the setup screams “go.”
How do I avoid fake signals?
- Wait for confirmation from at least 2 indicators.
- Check multiple timeframes (e.g., confirm a 1-minute signal on a 5-minute chart).
- Watch volume or candle strength.
Final Thoughts: Indicators Are Tools – You’re the Driver
Don’t let indicators control you. They’re your assistants, not your boss. The more you practice with them, the better you’ll feel the market rhythm.
Some days, even the best signals fail and that’s okay. Pocket Option is about precision, patience, and practice.
So next time you’re about to hit that green or red button, pause. Ask yourself:
- What’s the indicator saying?
- Is there confirmation?
- Am I chasing or am I focused?
If all boxes are ticked—pull the trigger. Trade smart, not fast.
P.S. Want me to break down more strategies or indicator combinations? I’d love to hear what you’re testing.
Happy trading!