Pocket Option Trend Trading Strategy: How to Follow Market Trends

I’ve blown a few accounts before I realized something important: the market doesn’t care how smart I think I am. Once I stopped trying to predict every reversal and started following the trend, things changed. That’s what I want to share with you today—my real experience using a Pocket Option trend strategy that works.
It’s not about finding the perfect entry every time. It’s about stacking small wins by riding the trend and avoiding stupid trades. I’ll walk you through the best trend indicators, the actual trades I took, and the costly mistakes I made when I ignored the trend.
Ready to follow the market instead of fighting it? Open your free Pocket Option account and start applying trend strategies with the indicators covered below.
What is a Trend Trading Strategy on Pocket Option?
A trend trading strategy is simple in theory. You identify the direction the market is moving—up, down, or sideways and trade in that direction. On Pocket Option, it means entering call options in an uptrend and put options in a downtrend. The goal is to ride the wave, not swim against it.
But here’s what most blogs don’t tell you: the real challenge isn’t spotting the trend—it’s trusting it. You see a strong upward move, your gut says “buy,” but your fear says, “what if it reverses?” That internal battle ruins more trades than bad signals.
So, let’s cut through the fluff. I’ll show you the exact indicators and setups I use, how I confirm a real trend, and when I stay out entirely.
Best Trend Indicators for Pocket Option
I’ve tested dozens of indicators. Some are flashy but useless. Others are boring but powerful. Here are the few that consistently work for me on Pocket Option:
1. Moving Averages (EMA/SMA)
I use:
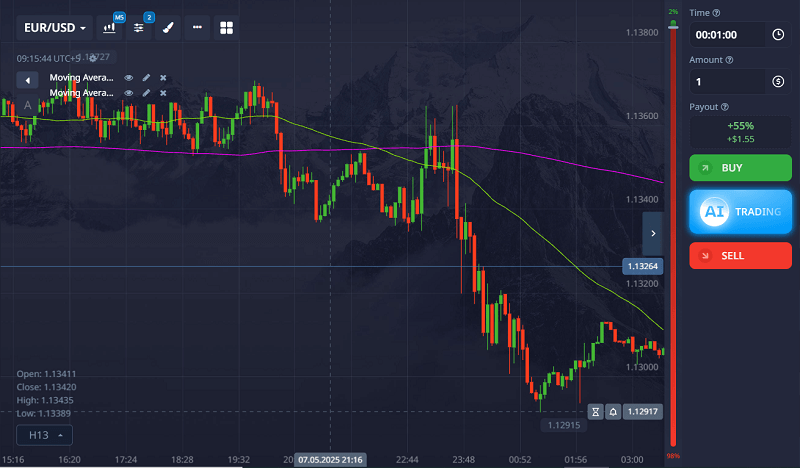
- 50 EMA to spot the medium-term trend
- 200 EMA for the long-term trend
If price is above both, I look for call options. If it’s below, I go for puts.
The crossover strategy (when the 50 EMA crosses the 200 EMA) also works as a confirmation signal, especially on M5 and M15 charts.

2. MACD (Moving Average Convergence Divergence)
MACD helps confirm the momentum behind the trend. When the MACD line crosses above the signal line and both are above zero, it supports a bullish trend.
For puts, the opposite: MACD crosses below the signal line and both are under zero.

3. RSI (Relative Strength Index)
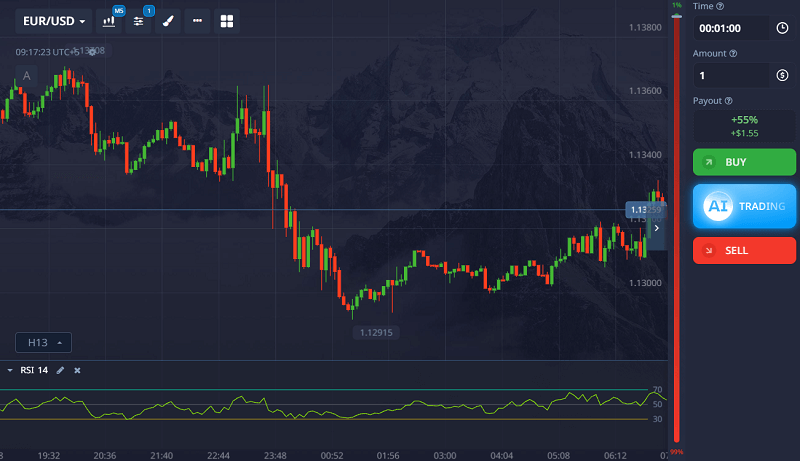
RSI is not just for spotting overbought or oversold. I use it to confirm trend strength.
In an uptrend, RSI should stay above 50. In a downtrend, below 50. If RSI keeps bouncing around 50, it’s a sign the trend is weak or changing.

4. ADX (Average Directional Index)
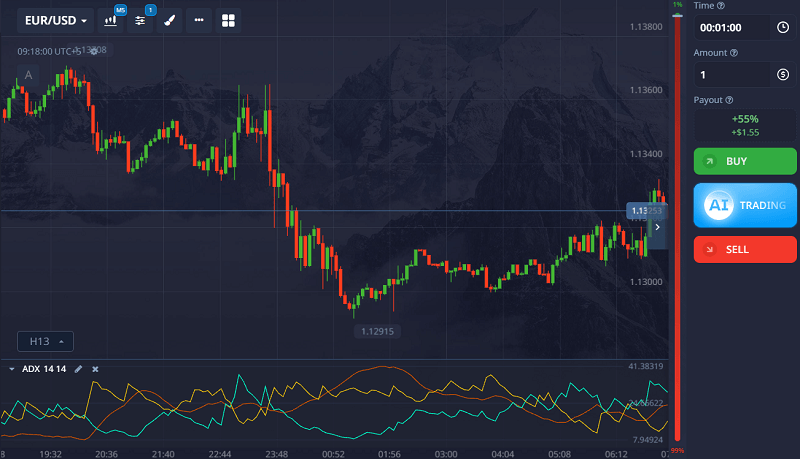
ADX doesn’t tell direction—it tells strength.
- ADX above 25 means a strong trend (I trade)
- ADX below 20 means a weak or choppy market (I stay out)
Combining ADX with EMA gives me confidence to enter.

5. Trendlines (Drawn Manually)
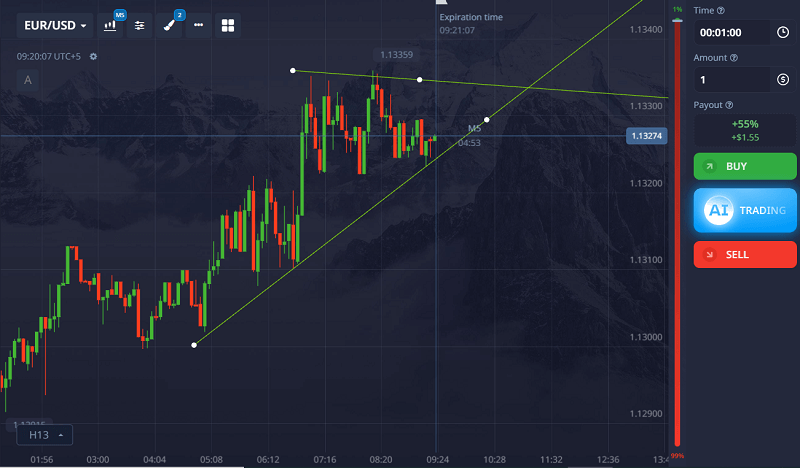
Don’t ignore the basics. Drawing trendlines gives me a clear view of market structure.
If price respects an upward trendline with multiple touches, I trust the uptrend. Breaks in the trendline tell me something is changing.

My Actual Pocket Option Trend Trading Example
Let me take you back to a trade I took on EUR/USD, 5-minute chart.
The setup:
- Price was above both 50 EMA and 200 EMA
- MACD lines were above zero and showing a bullish crossover
- RSI was holding steady around 60
- ADX was at 28
- Price bounced from an upward trendline drawn across 3 previous lows
All signs pointed to a strong uptrend.
I entered a call option with a 3-minute expiry right after a bullish engulfing candle appeared on the bounce. Result? ITM (In the money). Price continued up for the next 10 candles.
But more importantly, it was a clean, stress-free trade. No guessing. No hoping.
Learn more about Pocket Option trading hacks.
Want to test this strategy in real time? Sign up on Pocket Option and try trend trading with live charts, custom indicators, and 1-minute execution speed.
When Not to Use a Trend Strategy on Pocket Option
Here’s what rarely gets mentioned in other guides: the trend strategy does not work in all conditions.
I’ve learned to avoid these situations like the plague:
1. Ranging or Sideways Market
You’ll see this when price stays stuck between support and resistance with no clear direction. Moving averages flatten, RSI hugs 50, and ADX drops under 20.
If you try to trade trends here, you’ll lose more than you win.
2. Just After Big News Releases
Volatility spikes after events like NFP or interest rate decisions. Even if the trend looks strong, price can reverse suddenly. I avoid trend trades during news unless I understand the macro context (which, honestly, I usually don’t).
3. At the End of a Trend (Overextended)
If a trend has already run far without a decent pullback, I wait. It’s tempting to enter late, but that’s when trends usually reverse or stall.
Use RSI or look for bearish divergence on MACD to spot exhaustion.
4. During Market Open or Close
The first 15–30 minutes after a market opens (especially US and London sessions) can be wild. Price fakes out a lot. I wait for structure to settle before looking for a trend.
How I Confirm a Real Trend (Checklist)
This is my personal checklist before entering a trend trade:
- Price is above/below both 50 and 200 EMA
- MACD supports the direction
- RSI is above 50 (for calls) or below 50 (for puts)
- ADX is above 25
- Trendline support/resistance is respected
- No major news events in next 30 minutes
- I’m not entering at an obvious support/resistance zone
If any of these fail, I don’t trade.
Trend Entry Tactics I Use
Once I confirm the trend, I look for these setups to enter:
Pullback Entry
I wait for the price to pull back to the 50 EMA or trendline. Then I look for a bullish or bearish candlestick pattern (engulfing, pin bar, inside bar) before entering.
Breakout Entry
If price breaks a consolidation or resistance zone in the direction of the trend, I enter after the breakout candle closes. I don’t chase breakouts during low volume times.
Retest Entry
After a breakout, price often returns to test the broken level. This retest is a great entry if the trend continues. I use confirmation from MACD and RSI before entering.
Pocket Option Timeframes for Trend Trading
I mostly use:
- M5 (5-minute) for scalping
- M15 or M30 for more stable signals
I check H1 for the overall trend direction. If H1 is trending and M5 agrees, that’s a high-conviction trade.
Learn more about the best time to trade.
FAQs from Real Traders (Collected from Google and Answerthepublic)
How do I know if a trend is strong enough to trade?
Use ADX above 25, clear price movement in one direction, and confirmation from at least two indicators (like EMA and MACD).
Can I trade trends on Pocket Option using just price action?
Yes, if you’re skilled at reading market structure and trendlines. But combining it with at least one indicator increases your accuracy.
What is the best expiry time for trend trading on Pocket Option?
For M5 charts, I use 3-5 minute expiry. For M15, I go for 5-10 minutes. Always backtest to see what works best for your style.
Do trends reverse suddenly or give signs?
Most trends show signs before reversing—divergence on MACD/RSI, slowing momentum, or failed highs/lows. Watch for those.
Is trend trading better than reversal trading?
It depends on the trader. I find trend trading more consistent. Reversals are riskier and harder to time.
Can I use Bollinger Bands for trend confirmation?
Yes. In a trend, price often rides the outer band. A break and close beyond the band with volume can confirm continuation.
What is the success rate of trend trading on Pocket Option?
Personally, I get around 65-70% win rate with trend trades. The key is avoiding bad entries, not overtrading, and being patient.
Final Thoughts
Trend trading on Pocket Option changed the way I approach the market. I no longer fight the market. I let it lead and follow with discipline.
It’s not perfect. There are losing trades. But when you combine the right tools—EMA, MACD, RSI, trendlines—and wait for high-probability setups, it becomes a consistent strategy.
Remember, the hardest part is not spotting the trend. It’s sticking to the plan, avoiding overconfidence, and sitting on your hands when the market is choppy.
Start slow. Practice on demo. Build your confidence. Then scale.
I’ve learned the hard way so you don’t have to.
If you want me to break down one of your trend trades or help you set up your indicators, just ask. I’m happy to help. What’s your biggest struggle with trend trading right now?
Ready to ride the trend with confidence? Join Pocket Option now and use trend-friendly tools like EMA, RSI, and MACD, perfect for the strategies in this guide.