
"What if I invested $1,000 in X" hub
What If I Invested $1,000 in Tesla?
TSLA returns from the 2010 IPO to today — calculator, year-by-year data, and what the numbers leave out. Updated 2 August 2026 using TSLA's closing price of $311.21 on Friday, 31 July 2026.
The short answer
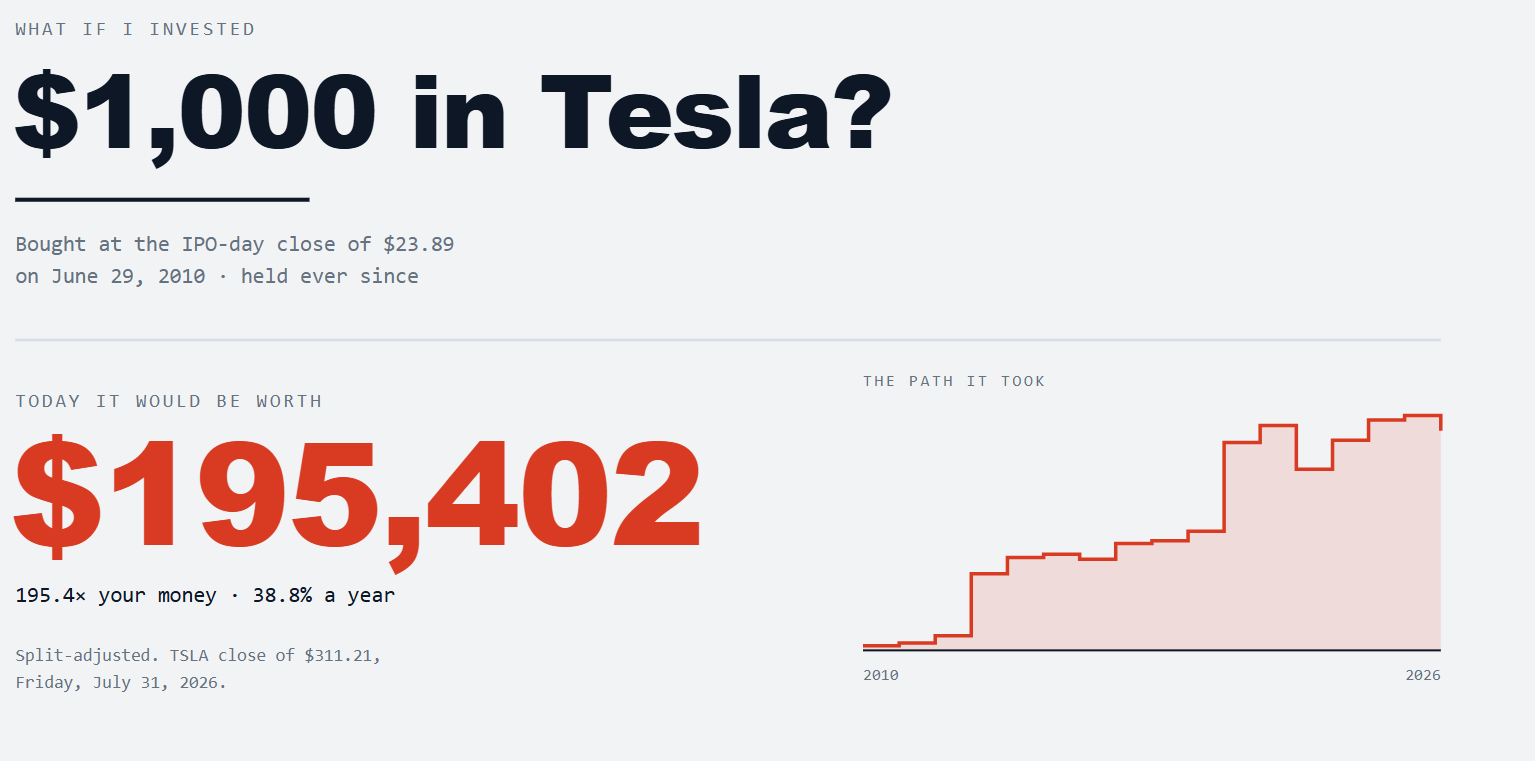
$1,000 put into Tesla at its IPO-day close on 29 June 2010 would be worth about $195,402 today — 195 times your money, or roughly 38.8% a year compounded over 16 years.
But the entry date does almost all of the work here. The same $1,000:
| You bought | $1,000 is now worth | Annualised |
|---|---|---|
| IPO day, June 2010 | $195,402 | +38.8% |
| January 2015 | $21,286 | +30.2% |
| January 2020 | $10,850 | +43.7% |
| January 2021 | $1,279 | +4.5% |
| January 2023 | $2,879 | +34.4% |
| January 2026 | $710 | −29.0% (7 months) |
Tesla pays no dividend, so these are pure price returns, adjusted for both stock splits.
Three things worth knowing about how the numbers are produced:
- Split adjustment is automatic. One share bought before August 2020 is fifteen shares today. The calculator uses adjusted prices throughout, so you never have to do that maths yourself.
- Lump sum, not drip-feed. It assumes you invested once and never touched the position. Monthly contributions would produce a very different — usually less extreme — result in both directions.
- No dividends, no fees, no tax. Tesla has never paid a dividend, so ignoring dividends costs you nothing here. Ignoring commissions, spreads, and capital gains tax flatters every figure on this page.
What $1,000 in Tesla is worth today, by entry year
$1,000 invested on the first trading day of each year and held through 31 July 2026:Market Forecast HubMarket Forecast Hub
| Bought | Entry price (split-adj.) | Shares | Value today | Total return |
|---|---|---|---|---|
| Jan 2011 | $1.77 | 563.5 | $175,359 | +17,436% |
| Jan 2012 | $1.87 | 534.2 | $166,245 | +16,525% |
| Jan 2013 | $2.36 | 424.2 | $132,020 | +13,102% |
| Jan 2014 | $10.01 | 99.9 | $31,100 | +3,010% |
| Jan 2015 | $14.62 | 68.4 | $21,286 | +2,029% |
| Jan 2016 | $14.89 | 67.1 | $20,895 | +1,990% |
| Jan 2017 | $14.47 | 69.1 | $21,513 | +2,051% |
| Jan 2018 | $21.37 | 46.8 | $14,564 | +1,356% |
| Jan 2019 | $20.67 | 48.4 | $15,053 | +1,405% |
| Jan 2020 | $28.68 | 34.9 | $10,850 | +985% |
| Jan 2021 | $243.26 | 4.1 | $1,279 | +28% |
| Jan 2022 | $399.93 | 2.5 | $778 | −22% |
| Jan 2023 | $108.10 | 9.3 | $2,879 | +188% |
| Jan 2024 | $248.42 | 4.0 | $1,253 | +25% |
| Jan 2025 | $379.28 | 2.6 | $821 | −18% |
| Jan 2026 | $438.07 | 2.3 | $710 | −29% |
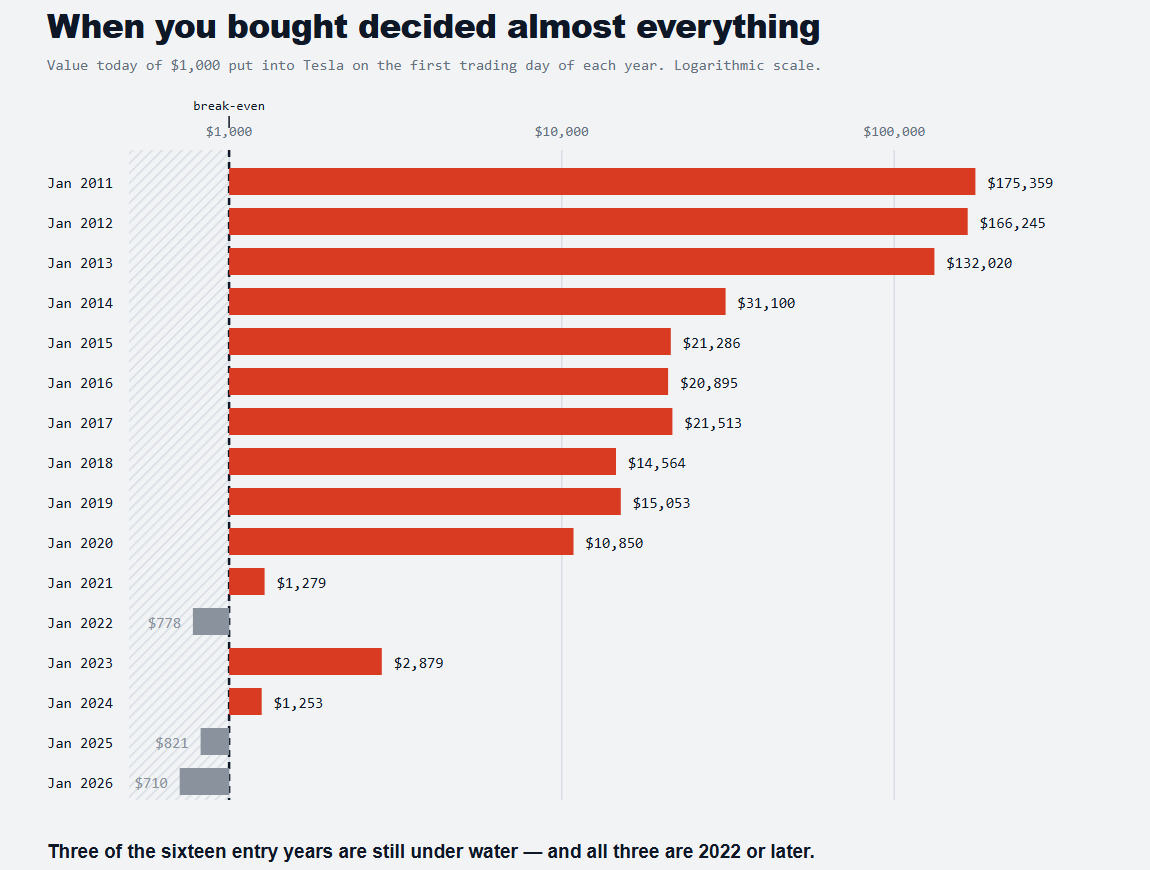
Three of the sixteen entry years are still under water, and all three are 2022 or later. That is the part the headline number tends to bury.
The IPO case
Tesla priced its IPO at $17 a share on 29 June 2010, selling 13.3 million shares and raising about $226 million — the first US carmaker to go public since Ford in 1956. The stock closed its first day at $23.89, up 40.5%.
Two versions of the "IPO investment" therefore circulate, and they differ by a lot:
- At the $17 offer price: $1,000 buys 882 split-adjusted shares → $274,597 today (+27,360%).
- At the $23.89 first-day close: $1,000 buys 628 split-adjusted shares → $195,402 today (+19,440%).
The second figure is the honest one for almost everybody. Retail investors could not get an allocation at the offer price in 2010; the earliest realistic entry was the open market on day one.
The best and worst moments to have bought
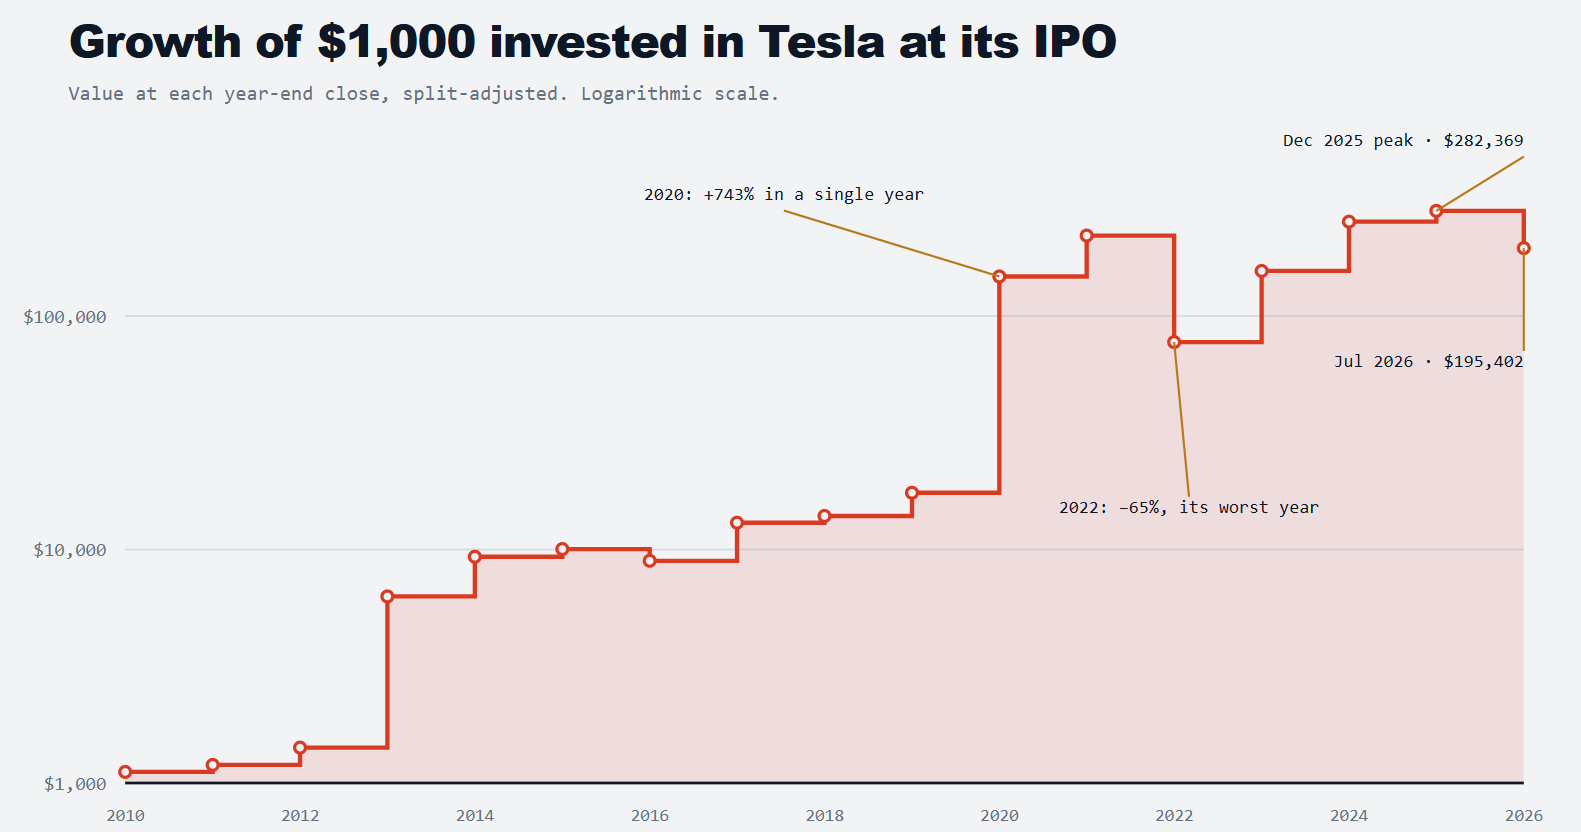
Best: the years nobody wanted it. A stake opened in January 2013 — before the Model S had proven itself and while the stock traded around $2.36 split-adjusted — is up more than 13,000%. January 2023, right after the worst year in the company's history, turned $1,000 into $2,879 in three and a half years.
Worst: the tops. $1,000 invested at the record close of $489.88 on 16 December 2025 is worth about $635 today, a 36.5% loss in seven months. Anyone who bought during the November 2021 euphoria watched the stock fall roughly 74% into the January 2023 low before it recovered.
Tesla has now put its shareholders through more than one drawdown deeper than 50%. Holding through those is the entire reason the long-run number looks the way it does — and it is the part that is easy to underwrite in a spreadsheet and hard to do in real life.
Tesla vs. the S&P 500
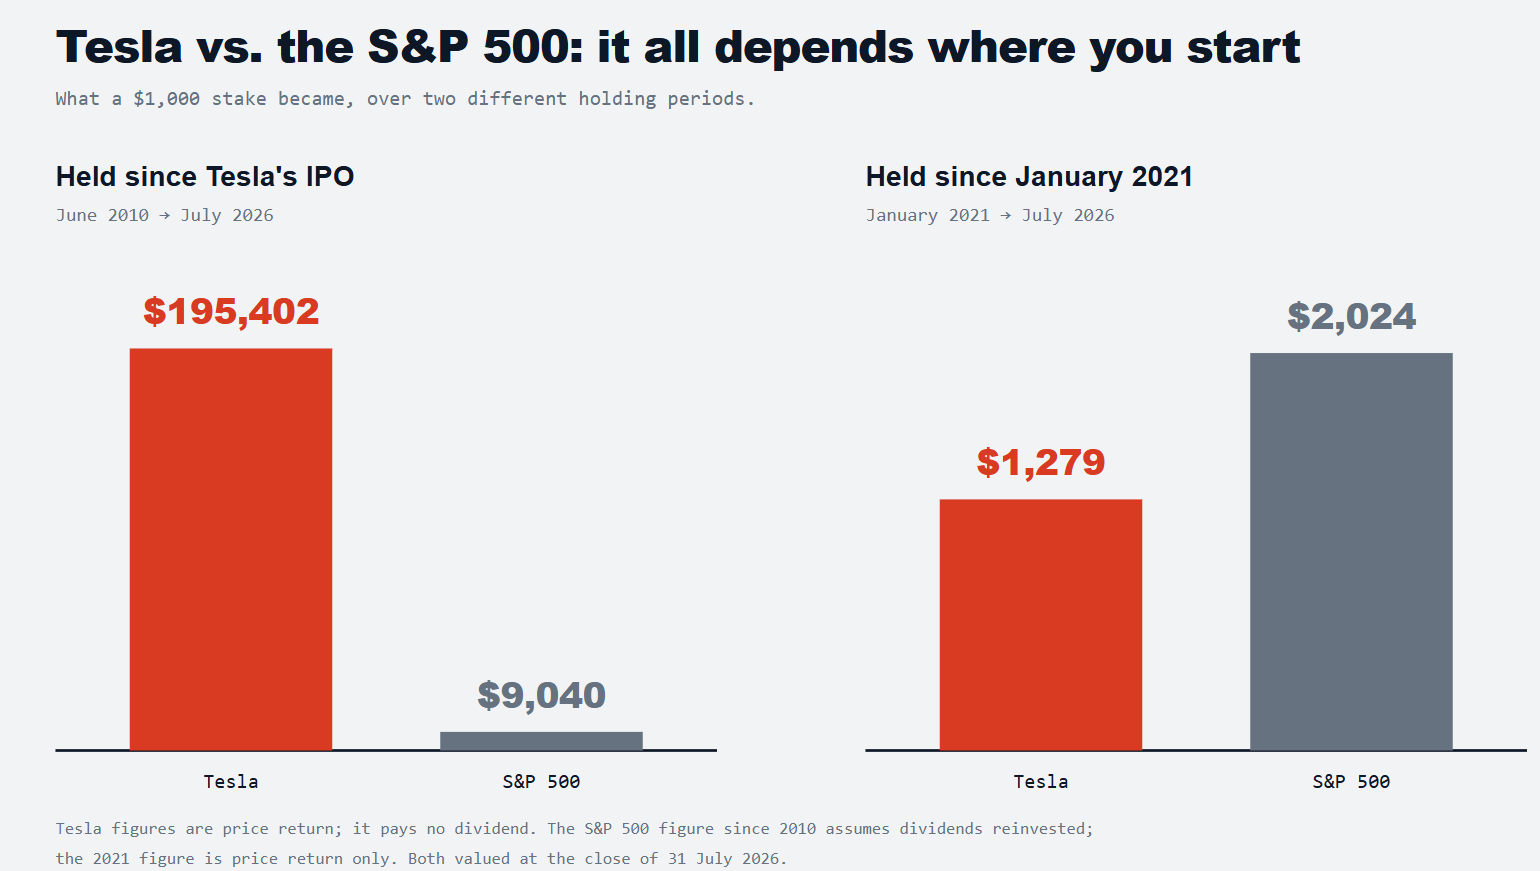
Since 2010, the comparison is not close. $1,000 in a plain S&P 500 index fund over that stretch, with dividends reinvested, grew to roughly $9,040. Tesla turned the same $1,000 into $195,402.
Shorten the window and the picture inverts. From January 2021 to today the S&P 500 roughly doubled a $1,000 stake, to about $2,024 on price alone. Tesla managed $1,279 over the same five and a half years. An investor who arrived at the start of 2021 took on a stock with a beta above 2 and several 40%-plus drawdowns, and was paid less than the index for it.
Both statements are true at once. That is what makes single-stock what-if numbers so easy to misread.
Why split-adjusted prices matter
Tesla has split twice:
| Date | Ratio | Effect on one pre-split share |
|---|---|---|
| 31 August 2020 | 5-for-1 | becomes 5 shares |
| 25 August 2022 | 3-for-1 | becomes 15 shares |
A single share bought in 2015 is fifteen shares today. This is why raw historical quotes are misleading: Tesla closed 2019 at $418.33 in the prices of the day, but that same moment is quoted as $27.89 on a split-adjusted chart. Every figure on this page uses adjusted prices. Splits create no value on their own — they just change the unit.
What actually moved the stock
The returns cluster around a handful of years, and each cluster has a story attached:
- 2010–2012 — the Roadster years. Tesla was selling a niche sports car and losing money. The stock barely moved: $1,000 at IPO was worth about $1,418 at the end of 2012.
- 2013 — Model S. The first mass-market-adjacent car landed and the stock rose 344% in a year.
- 2017–2019 — production hell, then Shanghai. Model 3 ramp problems, a going-concern scare, then the Shanghai factory coming online.
- 2020 — the repricing. First full year of profit, inclusion in the S&P 500 in December, and a 743% gain. This single year accounts for most of the long-run number.
- 2021 — the $1 trillion mark, reached in October.
- 2022 — the unwind. Down 65%, the worst year in the company's history, amid rate hikes, demand questions, and Musk's Twitter acquisition.
- 2023–2025 — recovery. Up 102%, then 63%, then 11%, to a record close of $489.88 in December 2025.
- 2026 so far — down about 31%. The stock has slipped from the December high, with a market capitalisation around $1.22 trillion and a trailing P/E near 289 even after the fall. Q2 deliveries came in at 480,126 vehicles, up 25% year on year, but the market has been focused on spending and on a fresh NHTSA probe covering roughly 1.2 million vehicles.
What this calculation does not tell you
- It is survivorship bias in its purest form. For every Tesla there are Fiskers, Nikolas, and Lordstowns. Running the same calculation on a 2010 EV portfolio would look nothing like this.
- Past returns say nothing about the next sixteen years. Tesla today is a $1.2 trillion company. Repeating a 195× return would imply a valuation larger than any company that has ever existed.
- Nobody actually held. The theoretical holder in these numbers never sold during a 74% drawdown, never rebalanced, never took profits. Almost no real investor behaves that way.
- Tax and fees are ignored. In a taxable account, a 19,000% gain comes with a capital gains bill that is not modelled here.
FAQ
How much would $1,000 in Tesla at IPO be worth today?
About $195,402 if bought at the first-day closing price of $23.89 on 29 June 2010, or $274,597 at the $17 IPO offer price. Both figures use TSLA's close of $311.21 on 31 July 2026.
What if I invested $1,000 in Tesla 5 years ago?
Roughly $1,279 for a start-of-2021 entry — a gain of about 28%, or 4.5% a year, which trails the S&P 500 over the same period.
What if I invested $1,000 in Tesla 1 year ago?
Tesla is down sharply from its December 2025 record close of $489.88, and a position opened at the start of 2026 is worth about $710. Short-horizon results are dominated by the December peak and the 2026 decline.
How many times has Tesla split its stock?
Twice — 5-for-1 in August 2020 and 3-for-1 in August 2022. One pre-2020 share equals fifteen shares today.
Does Tesla pay a dividend?
No. Tesla has never paid one, so its price return and total return are the same number.
Has Tesla beaten the S&P 500?
Over the full period since its IPO, by an enormous margin. Since the start of 2021, no — the index has outperformed it.
Methodology and sources
Prices are split-adjusted closes. Historical annual data is drawn from Macrotrends' TSLA series (sourced from Nasdaq); the current price is TSLA's close of $311.21 on 31 July 2026. IPO details are from Tesla's 2010 offering and contemporaneous reporting. The S&P 500 figure since 2010 assumes dividends reinvested; the 2021 comparison is price return only, against a July 2026 index level of 7,489.72. Returns are lump-sum and exclude commissions, spreads, and taxes. Annualised figures are compound annual growth rates.
This article is for information only. It is not investment advice, and nothing here is a recommendation to buy or sell any security. Past performance does not predict future returns.
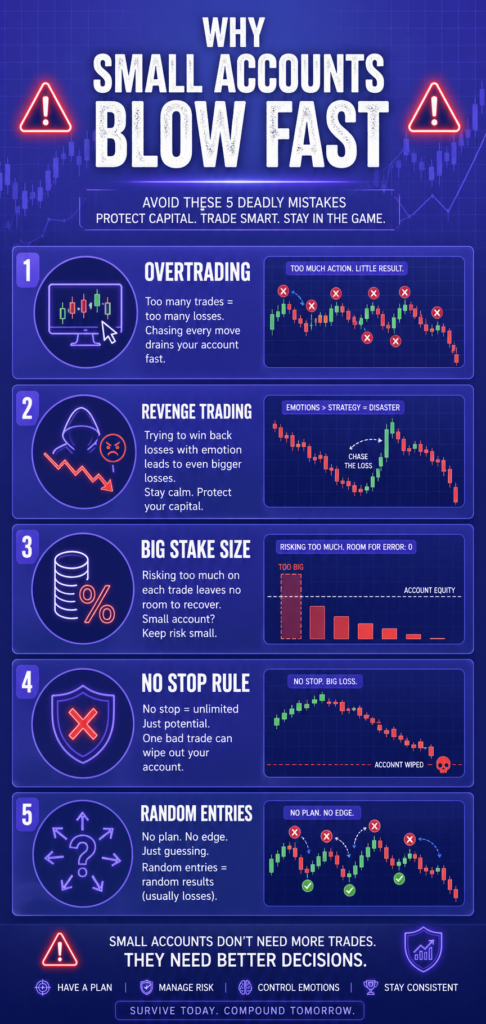
Risk Management for Small Accounts ($10–$50)
Starting with a small trading account can feel frustrating. You want fast growth, but one bad decision can wipe out weeks of progress. That is why risk management matters more for a $10 account than for a $1,000 account. Many beginners focus only on strategy. They search for the best indicators, signals, or entry methods. […]

Deriv Volatility 75 Strategy Backtest: What Actually Works After 1,000 Trades?
The first time I tried trading Volatility 75, I thought I had found the perfect market. No news shocks. No central banks. Just clean, continuous price movement. Within two weeks, I blew my first account. That experience forced me to stop guessing and start testing. Instead of chasing indicators or copying strategies from forums, I […]

EUR/USD holds 1.1414 before the ECB decision: three scenarios
EUR/USD traded near 1.1414 before the ECB’s July decision. Here is what a hold, hawkish hold or surprise hike could mean for 1.1350 and 1.1480.

WTI reaches $89.43 as Brent clears $95 on renewed supply risk
WTI traded near $89.43 while Brent moved above $95 as Middle East shipping risk lifted crude for a fifth session. Key levels, catalysts and invalidation.

Alphabet falls to $329.71 premarket as AI spending eclipses cloud growth
Alphabet traded near $329.71 premarket after strong Q2 revenue and cloud growth collided with a much larger AI spending plan. What investors need to watch.

Bitcoin slips to $65,741 as oil and yields test the breakout
Bitcoin is near $65,741 as rising oil and Treasury yields test the $65.7K breakout floor. Here are the levels that confirm or invalidate the move.