USD/MXN Stalls at the 17.60 Supply Ceiling as Carry Still Favors the Peso
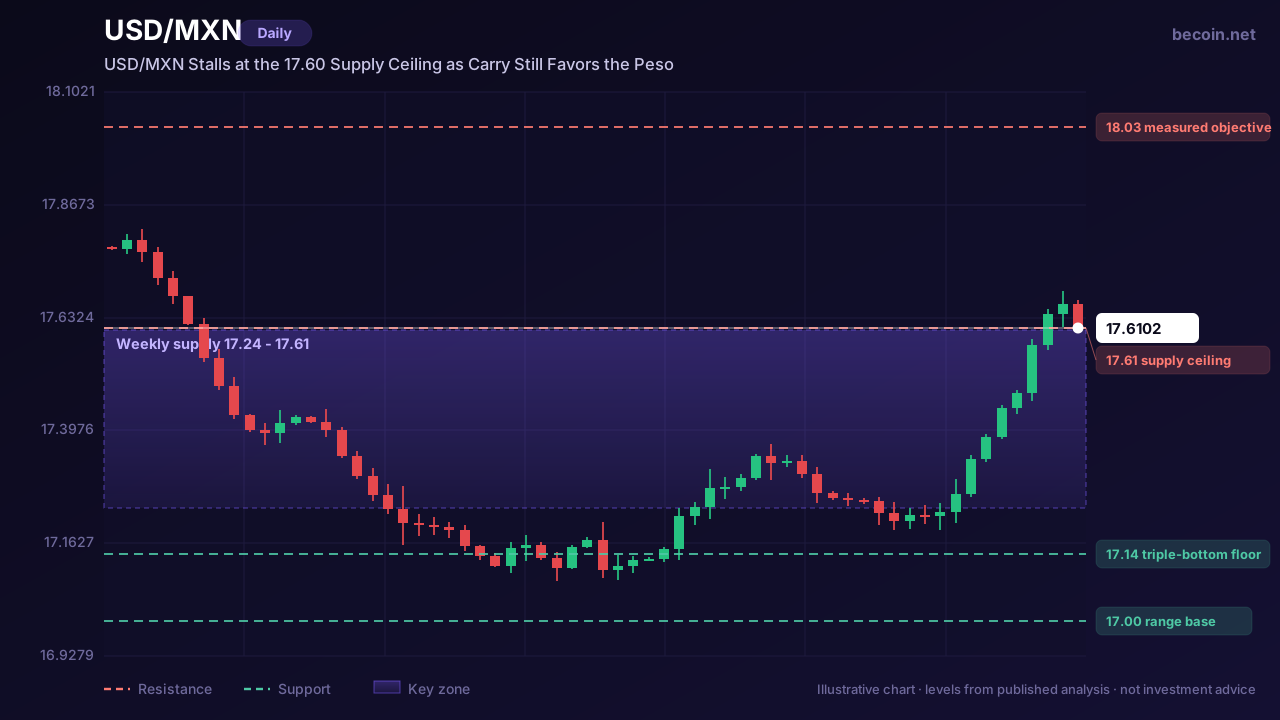
USD/MXN is trading around 17.61, a little firmer on the day but still roughly five percent lower than it was a year ago. That single line captures the whole story of this pair in 2026: the dollar keeps mounting recoveries, and the peso keeps absorbing them.
The band that keeps ending rallies
Every meaningful bounce since spring has died in the same neighbourhood. Roughly 17.24 to 17.61 is where sellers have consistently reappeared, and the current price sits at the very top edge of it. That is not a coincidence — it is where earlier buyers who bought too high are finally getting a chance to exit flat, and where the systematic sellers who faded the last three attempts are already positioned.
What makes this attempt slightly more interesting than the previous ones is the structure underneath it. Price built a cluster of lows in the 17.14 to 17.15 area rather than one clean spike, and it has been grinding higher off that base rather than snapping up. Slow, overlapping advances into resistance are usually weaker than sharp ones, but they also tend to leave fewer trapped longs behind if the level does give way.
Carry is still the quiet argument
The reason the peso has been so hard to knock over has very little to do with chart patterns. Banxico's policy rate remains far above what a dollar holder earns, and the gap has been wide enough for long enough that carry positioning has become a structural feature of this pair rather than a tactical trade. Layer on the nearshoring flows that continue to route manufacturing investment into northern Mexico, and you get a currency with a persistent bid that shows up on dips. Our Becoin.net Premium Forecast tracks this pair through each of those levels session by session.
That is also the vulnerability. Crowded carry trades do not unwind gently. They unwind when funding costs move or when volatility spikes, and when they do, the move happens faster than the technicals suggest it should. A trader who is short this pair because "the trend is down" is, whether they frame it that way or not, also short volatility.
USD/MXN levels that decide the next leg
The clean read is this. A daily close above 17.61 that holds for a second session turns the ceiling into a floor and opens the 18.03 area, which is where the measured move from the base projects and where the pair last spent real time. Below that, the 17.14 to 17.15 shelf is the line that has defined the entire range. Losing it on a closing basis would be the first genuine structural break in months and would put the psychological 17.00 handle into play quickly.
Between those two markers, this is a range, and range behaviour rewards patience over conviction. The most common way traders lose money on USD/MXN is not by picking the wrong direction — it is by taking a position in the middle of an eighty-centavo band and calling it a trend.
Where the idea stops working
If you are leaning short into the supply zone, a sustained close above 17.61 is the invalidation, not a wider stop. If you are leaning long on a breakout, a close back inside the band after breaking out is the tell that it was a liquidity grab rather than a trend start. Either way, the level does the work — the narrative just tells you why the level is there.
One last thing worth watching: this pair has a habit of making its decisive move around Banxico decisions and US inflation prints rather than in quiet sessions. Position size accordingly, and treat a breakout that happens on an empty calendar with more suspicion than one that happens on a catalyst.
Access levels for the daily level maps, scenario updates and alerts are set out on Becoin.net Tariff Plans.
This is market analysis for educational purposes and is not investment advice. Trading carries risk of loss.

$10 to $50 Trading Challenge – Strategy + Real Results (Case Study)
Turning $10 into $50 sounds easy until you actually try it. Small accounts expose every weakness in your trading. One bad decision can erase hours of progress, and emotional trading becomes much harder to control when every dollar matters. This case study breaks down how a $10 account was realistically grown to $50 using a […]
Capital Core Verification Process Explained: KYC, Restrictions, and Withdrawal Delays
I learned something the hard way with offshore-style brokers: the smoothest part is usually opening the account, funding it, and placing the first few trades. The real test starts when you try to move money back out. That’s exactly why I wanted to document the Capital Core verification process from a trader’s perspective, not from […]

EUR/USD holds 1.1414 before the ECB decision: three scenarios
EUR/USD traded near 1.1414 before the ECB’s July decision. Here is what a hold, hawkish hold or surprise hike could mean for 1.1350 and 1.1480.

The Day I Stopped Trading and Finally Started Making Money
It was a rainy Tuesday morning, and I was staring at my screen with a familiar knot in my stomach. The previous three days had been a slow, agonizing slide into the red. I had given back two weeks of hard-earned profits in less than seventy-two hours. Every asset I clicked on looked like a […]

The Best Broker Without Complicated Features (And Why Simplicity Wins)
Most traders don’t fail because they lack knowledge. They fail because their platform buries them in noise before they even place their first trade. Here’s what actually works. It Started With a Confession From a $10 Trader A reader messaged us a few months back. He had been trying to trade for three weeks, had […]

Bitcoin slips to $65,741 as oil and yields test the breakout
Bitcoin is near $65,741 as rising oil and Treasury yields test the $65.7K breakout floor. Here are the levels that confirm or invalidate the move.