US National Debt 2026: How Much Does America Owe?
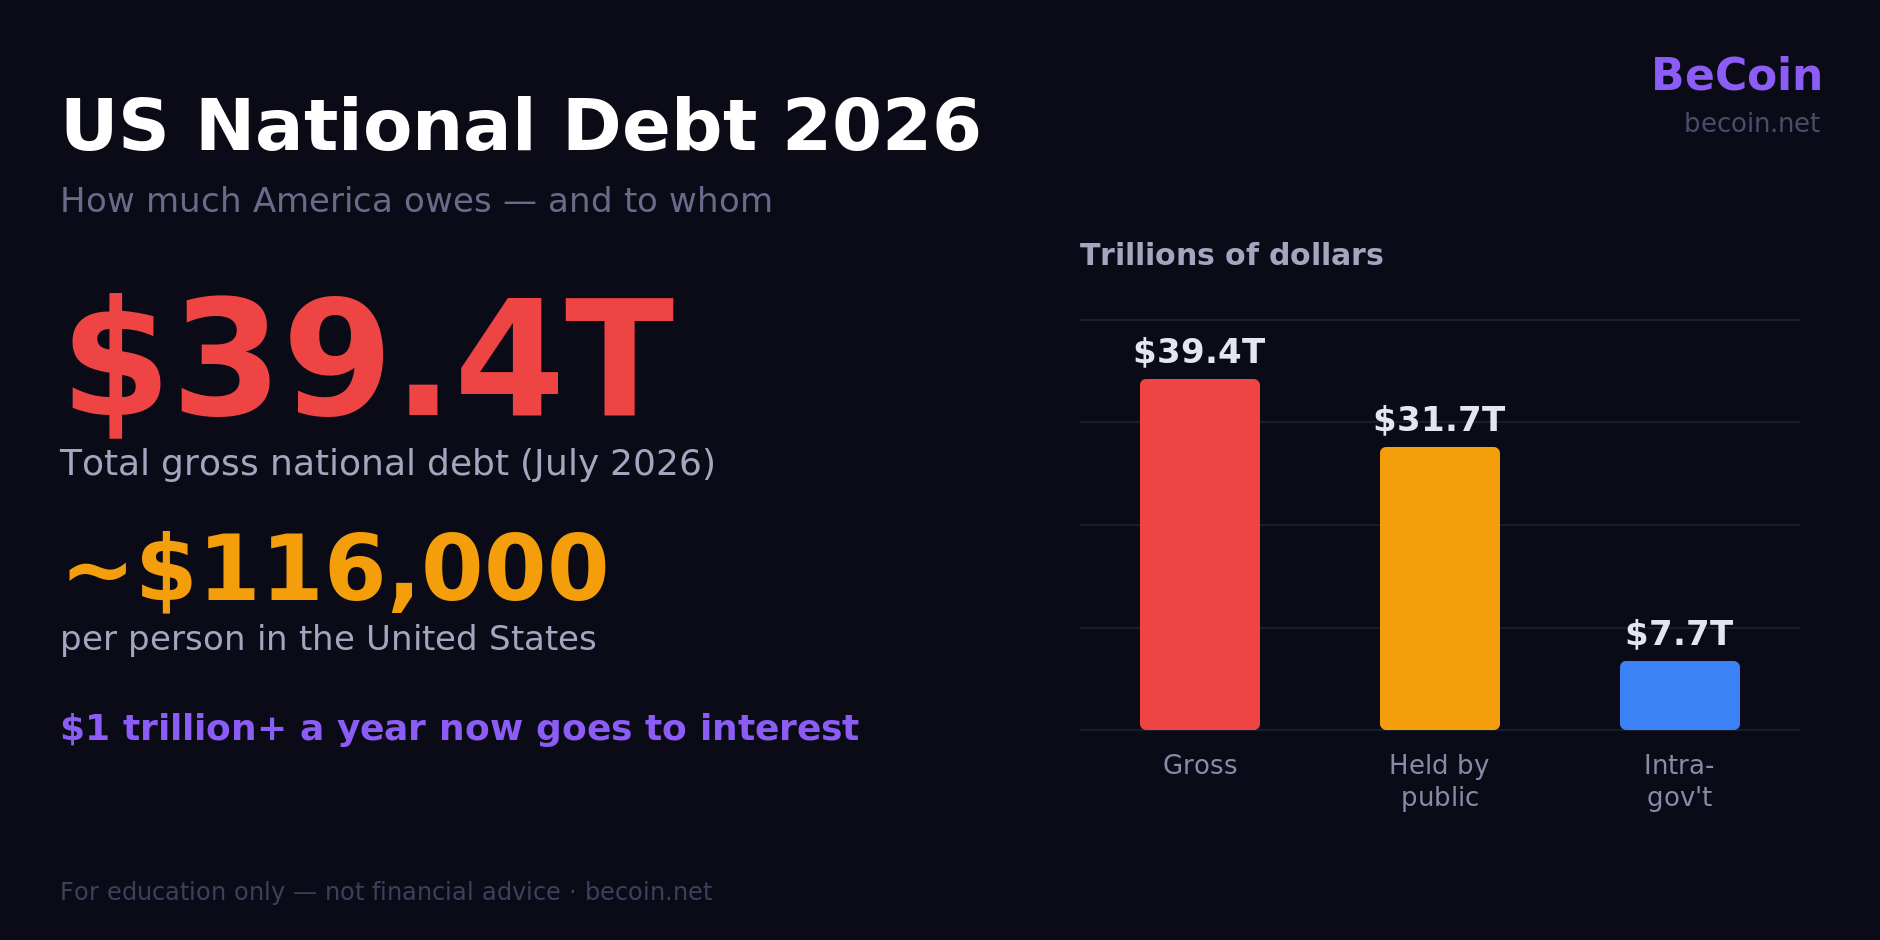
The US national debt is more than $39 trillion in 2026 — about $39.4 trillion as of early July 2026. That works out to roughly $116,000 for every person in the country, or about $250,000 per taxpayer. The debt has grown by roughly $2.8 trillion over the past year — close to $7.7 billion a day — and for the first time the government is now spending more than $1 trillion a year just on interest.
Updated July 2026. Debt figures are drawn from the US Treasury and the Joint Economic Committee and are dated below; the total rises continuously.
US national debt right now (2026)
| Measure | Amount (2026) |
|---|---|
| Total gross national debt | ~$39.4 trillion (early July 2026) |
| Debt held by the public | ~$31.7 trillion |
| Intragovernmental debt | ~$7.7 trillion |
| Increase over the past year | ~$2.8 trillion (~$7.7 billion/day) |
| Increase over the past five years | ~$10.9 trillion |
| Per person | ~$116,000 |
| Per taxpayer | ~$250,000 |
| Annual interest cost (FY2026) | ~$1.0 trillion |
| Debt-to-GDP (gross) | ~122–123% |
Sources: US Congress Joint Economic Committee monthly debt updates (2026), US Treasury Fiscal Data, Peter G. Peterson Foundation. Figures rounded and dated to mid-2026.
Which "debt" number is right?
People quote wildly different figures for the US debt, and they can all be correct at once — because there are three different measures:
Total gross national debt (~$39.4T) is the headline number on most debt clocks. It is everything the federal government owes.
Debt held by the public (~$31.7T) is the portion owed to outside investors — individuals, companies, pension funds, foreign governments and the Federal Reserve. Economists usually treat this as the most meaningful figure, because it is money the government actually has to raise from markets.
Intragovernmental debt (~$7.7T) is money the government owes itself — mostly IOUs held by trust funds such as Social Security and Medicare that have run surpluses in the past.
Add the last two together and you get the gross total. So when one source says "$39 trillion" and another says "$32 trillion," neither is wrong — they are simply counting different things. This is the single biggest source of confusion in national-debt coverage.
Who owns the US national debt?
Roughly four-fifths of the gross debt is held by the public and one-fifth is intragovernmental. Within the public share, the largest holders are US investors and institutions — mutual funds, banks, insurers, state and local governments, and the Federal Reserve. Foreign holders own a meaningful slice, led for years by Japan as the largest foreign creditor, followed by other major economies and the United Kingdom; China, once the top foreign holder, has steadily trimmed its US Treasury holdings over the past decade. The idea that any single foreign country "owns America's debt" is a myth — the vast majority is owed to domestic holders and the government's own trust funds.
The $1 trillion interest bill
The most important shift in 2026 is not the size of the debt but the cost of carrying it. The federal government is now spending about $1.0 trillion a year on interest — roughly 3.3% of GDP, the highest on record, eclipsing the previous peak set in 1991. Interest now consumes about 18.6% of all federal revenue, meaning nearly one in every five tax dollars goes to servicing past borrowing rather than funding current programs.
Put another way: interest has grown into one of the single largest lines in the entire federal budget, rivaling or exceeding what the government spends on national defense. Higher interest rates since 2022 mean each dollar of debt is now far more expensive to roll over than it was in the low-rate 2010s.
Debt-to-GDP: how 2026 compares to history
The raw dollar figure matters less than the debt relative to the size of the economy. With gross debt near $39 trillion and annual GDP around $30–31 trillion, the gross debt-to-GDP ratio sits near 122–123%, and debt held by the public is around 101% of GDP.
| Period | Debt-to-GDP (gross, approx.) | Context |
|---|---|---|
| 1946 (post-WWII peak) | ~118% | Financing World War II |
| 1980 | ~35% | Decades of post-war growth lowered the ratio |
| 2000 | ~55% | Late-1990s budget surpluses |
| 2008–09 | ~68 → 82% | Global financial crisis |
| 2020 | ~127% | COVID-19 emergency spending |
| 2026 | ~122–123% | Elevated deficits and higher interest costs |
Today's ratio is the highest sustained level since World War II. The Congressional Budget Office projects debt held by the public will keep climbing from about 101% of GDP in 2026 toward 120% by the mid-2030s if current policies continue.
How did the debt get so big?
The debt grows whenever the government spends more than it collects and covers the gap by borrowing. The biggest single jumps came from crisis responses — the 2008 financial crisis and, far larger, the 2020–21 pandemic, which added trillions in a matter of months. Beyond crises, structural deficits (spending on Social Security, Medicare, defense and interest running ahead of tax revenue) mean the debt has risen under both parties for decades. In just the last five years alone it has grown by roughly $10.9 trillion.
Frequently asked questions
How much is the US national debt in 2026?
More than $39 trillion — about $39.4 trillion as of early July 2026, and still rising by roughly $7.7 billion a day.
How much national debt is that per person?
Roughly $116,000 for every person in the United States, or about $250,000 per taxpayer.
Who does the US owe money to?
Mostly to itself and its own citizens. About four-fifths is held by the public (US funds, banks, the Federal Reserve, and foreign investors led by Japan), and about one-fifth is intragovernmental debt owed to trust funds like Social Security.
How much interest does the US pay on the debt?
About $1.0 trillion a year in FY2026 — roughly 3.3% of GDP and around 18.6% of all federal revenue, both record highs.
Is the US debt-to-GDP ratio dangerous?
At ~122–123% gross (and ~101% for debt held by the public), it is the highest since World War II. Economists disagree on the exact danger point, but most agree the rising interest burden makes the current path hard to sustain indefinitely.
Methodology & sources
Debt totals are from the US Congress Joint Economic Committee's 2026 monthly debt updates and US Treasury Fiscal Data; interest-cost and share-of-revenue figures are from the Peter G. Peterson Foundation and the Congressional Budget Office; historical debt-to-GDP figures are approximate and drawn from Treasury/FRED historical series. All figures are dated to mid-2026 and rounded; the total debt rises continuously, so a live counter will show a higher number than any fixed snapshot here. This article is for education and information only and is not financial or policy advice.
Want to see how macro forces like debt and inflation feed into asset prices? Explore the BeCoin forecast hub, read our companion data page on how much money there is in the world, or check the Buffett indicator on market valuation. Some investors watch the debt as part of the case for hard assets like Bitcoin. Related reading: billionaire statistics. Browse more free tools.
Get full access to all 100+ assets →
This content is for educational purposes only and does not constitute financial advice. Markets are volatile and past performance does not guarantee future results.

Safest Trading Platforms (Risk Breakdown) – Real Comparison for 2026
Choosing a trading platform isn’t about features — it’s about avoiding hidden risk. Most traders compare brokers like Quotex vs Pocket Option vs Deriv vs Olymp Trade expecting a clear winner. Instead, they find conflicting reviews, promotional claims, and no real explanation of how these platforms behave when money is on the line. The real […]

How Many People Own Bitcoin? (2026 Data, Charts & Country Breakdown)
About 365 million people owned Bitcoin in 2025 - roughly 4-4.5% of the world and nearly half of all crypto owners. See the year-by-year growth curve, country data, whole-coin rarity, and why estimates disagree.

Deriv vs IQ Option for Synthetic Indices: Which Platform Is Better in 2026?
Synthetic indices have become one of the most talked about trading categories among beginners and experienced traders alike. Unlike forex or crypto markets that depend on real world events, synthetic indices operate 24/7 using algorithm driven price movements. That means traders can access opportunities at any time without waiting for market openings or major news […]

Best Broker for One Trade a Day Strategy in 2026
Most traders lose money because they trade too much. They enter random setups, chase candles, overreact emotionally, and turn a simple strategy into pure gambling. That is exactly why the one trade a day strategy is becoming more popular among smart traders in 2026. Instead of sitting in front of charts all day, this approach […]

Which Broker Is Better for Students in 2026?
For students, trading usually starts with one simple goal: learning how markets work without risking too much money. Most students are not starting with huge budgets. They are trading from a phone, using mobile internet, balancing studies, and trying to avoid losing money quickly. That changes what actually matters in a broker. The “best broker” […]

Binomo vs IQ Option Withdrawal Speed: Full 2026 Comparison Guide
Withdrawal speed is one of the most important factors for traders, especially beginners who want quick access to profits. A platform may look good for trading, but if getting your money takes too long, frustration builds fast. In this detailed comparison of Binomo and IQ Option, we will break down real withdrawal timelines, processing behavior, […]