Buffett Indicator Today: 218% in July 2026, Explained
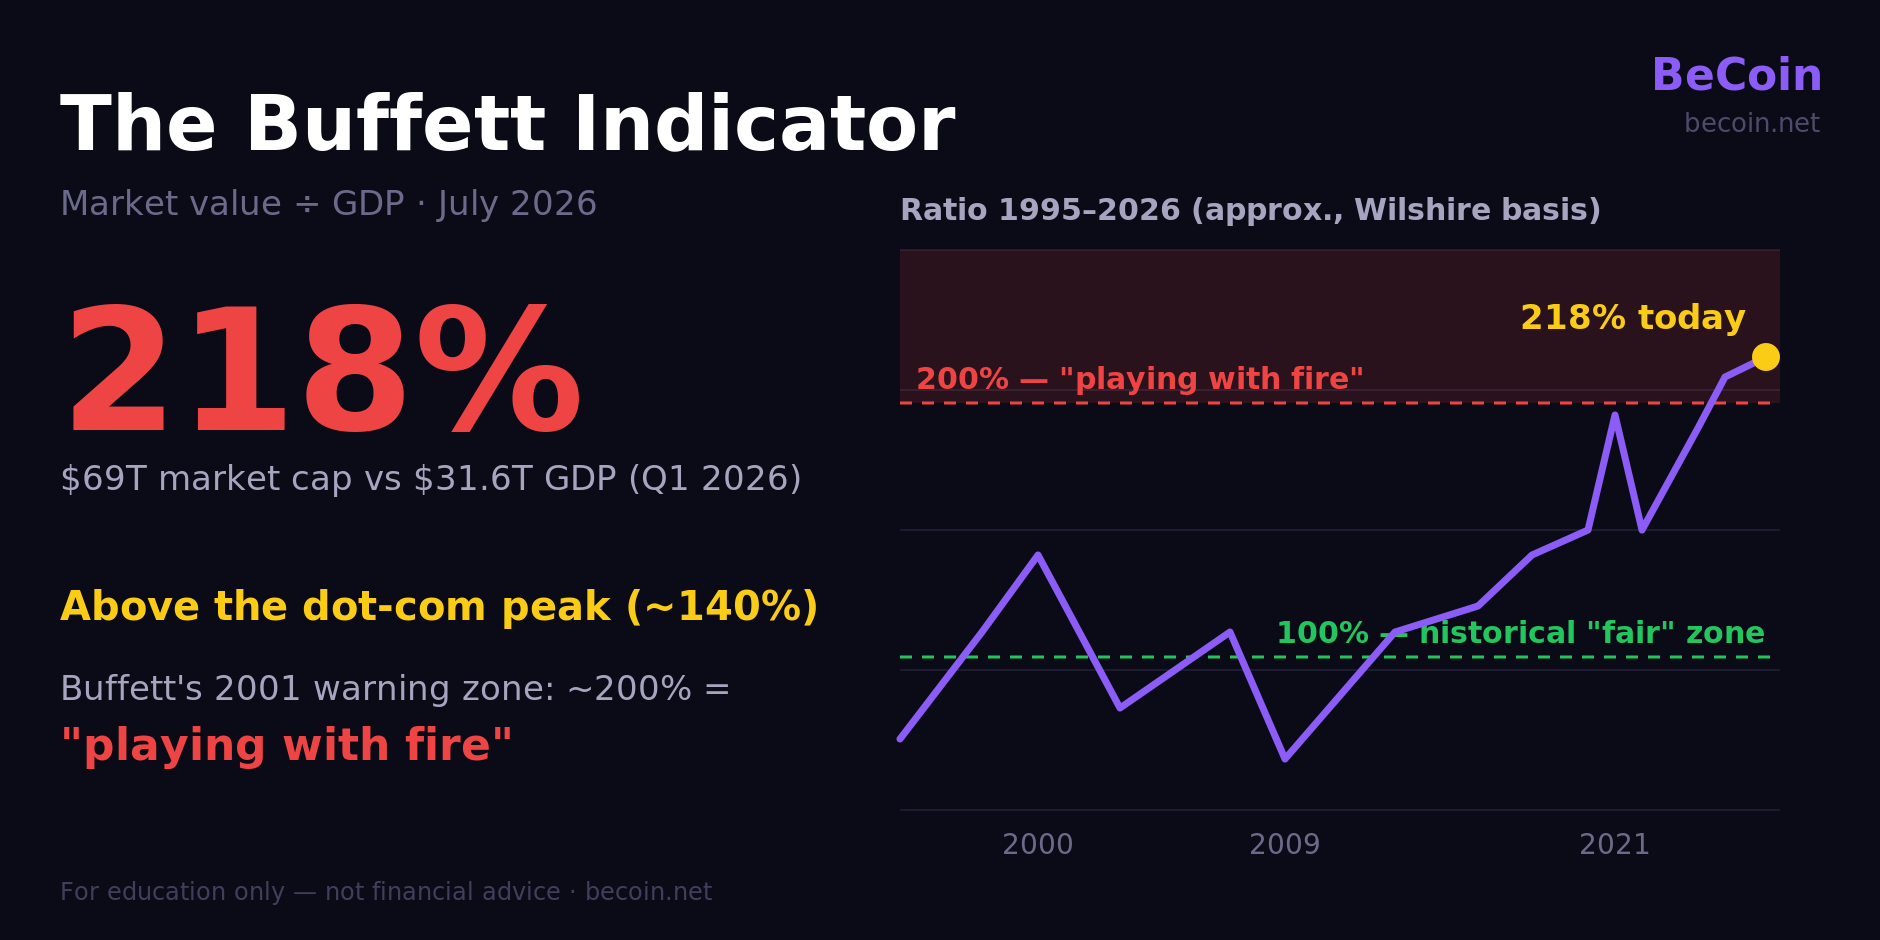
The Buffett indicator stands at about 218% as of mid-July 2026 — meaning the total value of the US stock market is more than twice the size of the US economy. That is among the highest readings in history and far above the level Warren Buffett once said signals "playing with fire." The indicator divides total US stock market capitalization (about $69 trillion) by annualized GDP (about $31.6 trillion). Depending on the exact method, current readings range from 214% to roughly 238% — and understanding why they differ matters more than the decimal.
What is the Buffett indicator?
The Buffett indicator — formally the market capitalization-to-GDP ratio — compares the total value of all publicly traded US stocks with the country's annual economic output:
Buffett indicator = total US stock market value ÷ gross domestic product
Warren Buffett made the ratio famous in a December 2001 Fortune interview, calling it "probably the best single measure of where valuations stand at any given moment." The logic: stock prices represent expectations of future economic activity, while GDP measures actual current activity. When the market grows far faster than the economy underneath it, expectations may have detached from reality. Buffett himself has since walked back the endorsement, cautioning that no single metric works in all eras — a caveat most articles skip.
What is the Buffett indicator today?
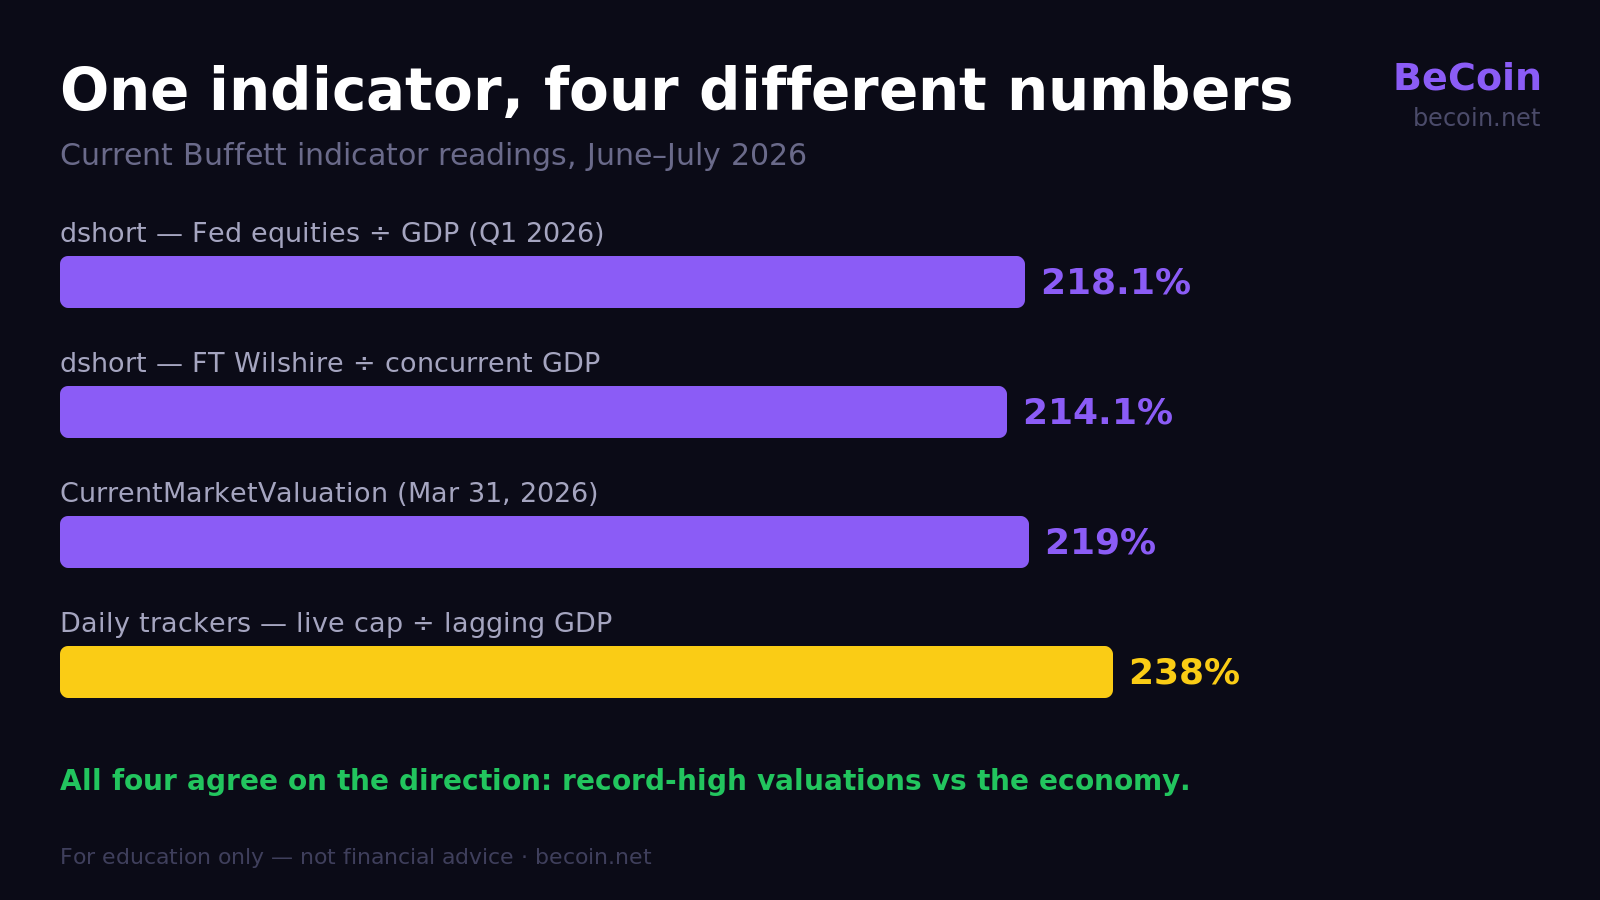
Here are the current readings from the most-cited trackers, all as of June–July 2026:
| Source / method | Reading | As of | Verdict |
|---|---|---|---|
| Advisor Perspectives (dshort) — Fed corporate equities ÷ GDP | 218.1% | Q1 2026 (published Jul 8, 2026) | Overvalued; 4th-highest reading in history |
| Advisor Perspectives — FT Wilshire 5000 ÷ concurrent GDP | 214.1% | Q1 2026 | 2nd-highest in that series' history |
| Current Market Valuation — Wilshire-based ÷ GDPNow estimate | 219% | Mar 31, 2026 | "Strongly overvalued" (~2.1 standard deviations above trend) |
| Daily trackers (e.g. Buffett Indicator Live) — live market cap ÷ last reported GDP | ~238% | Mid-July 2026 | Significantly overvalued |
Every method agrees on the direction: by this measure, the US stock market is more expensive relative to the economy than at any previous era, including the dot-com bubble.
Why every website shows a different number
Four honest methodological choices produce the 214%–238% spread. The numerator differs: some use the Federal Reserve's "corporate equities" series, others the Wilshire 5000 index. The denominator lags: GDP is published quarterly and months in arrears, so daily trackers divide today's market cap by an economy measured last quarter — which inflates the ratio in rising markets (Advisor Perspectives explicitly warns against this mix). GDP gets revised: the same Q1 2026 reading moved from 229.7% after the second GDP estimate to 218.1% after the third. And some models compare the raw ratio against a rising historical trend line rather than a fixed threshold, which is why "219%" can be described as 2.1 standard deviations above trend rather than as an absolute record. None of these versions is wrong — but quoting a Buffett indicator without its method and date is meaningless.
Buffett indicator: historical highs and lows
| Period | Approximate reading | Context |
|---|---|---|
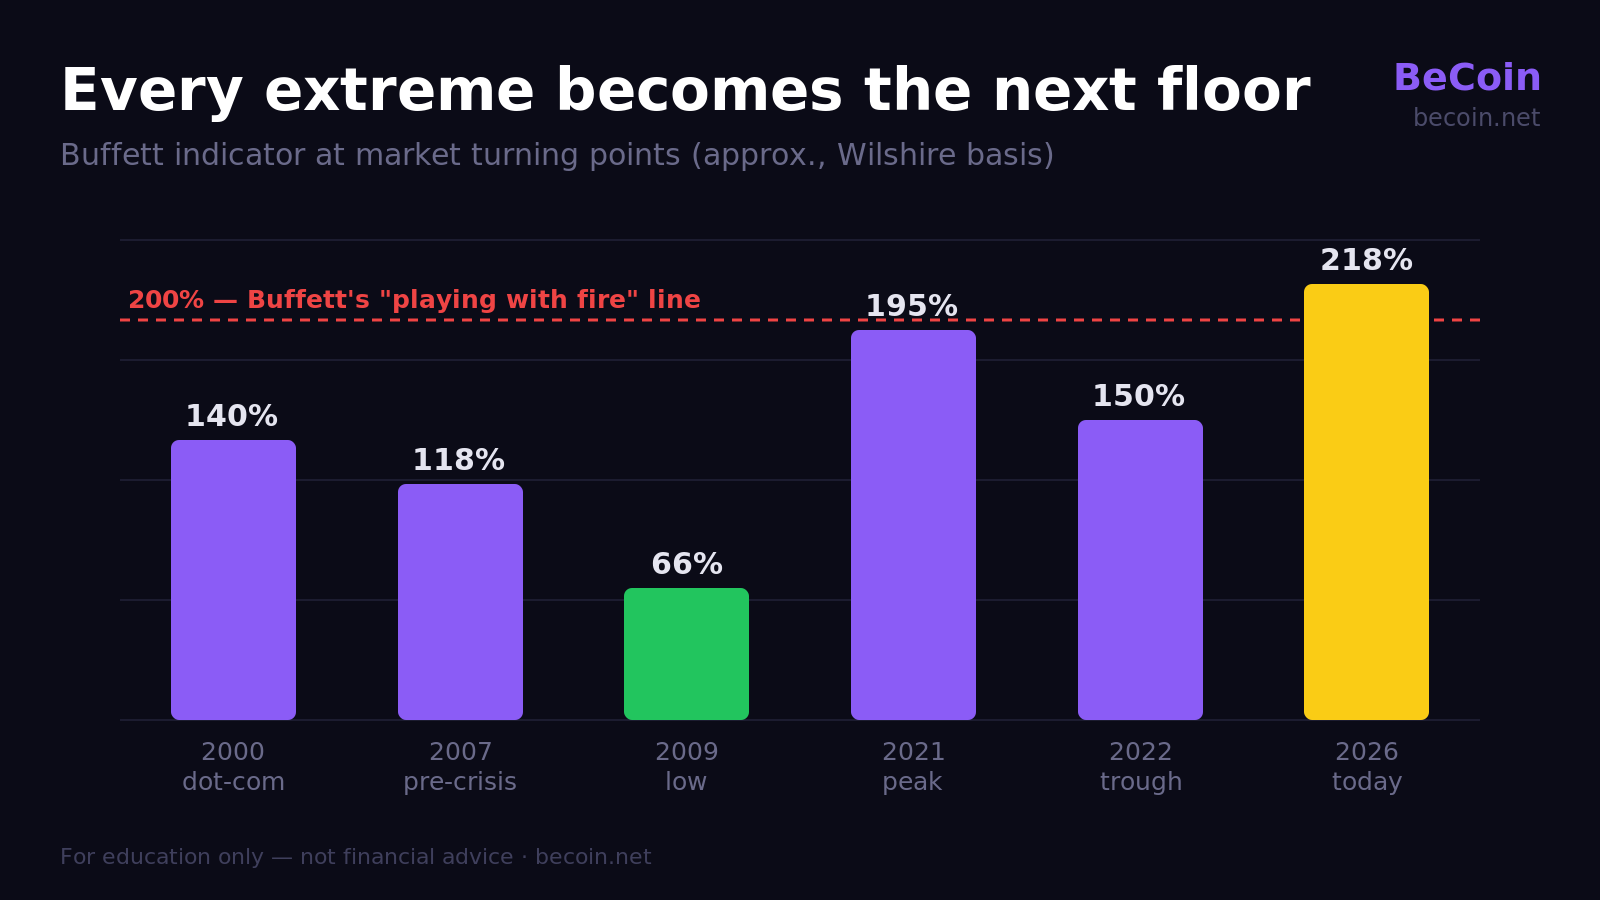
| March 2000 (dot-com peak) | ~137–140% (Wilshire basis); ~118% (Fed data basis) | Preceded a ~49% S&P 500 decline |
| 2007 (pre-crisis peak) | ~110–118% | Preceded the 2008–09 financial crisis |
| Q1 2009 (crisis low) | ~57–67% | Generational buying opportunity in hindsight |
| February 2021 | ~190% | "Everything bubble" era; approached 200% by November 2021 |
| 2022 (bear-market trough) | ~150% | Still above the 2000 peak |
| Late 2025 – 2026 | ~214–238% depending on method | Record territory; AI-driven mega-cap rally |
The striking pattern: each cycle's "extreme" becomes the next cycle's floor. The 2022 bear-market low never fell below the 2000 bubble peak. That is a big part of why analysts de-trend the data instead of using Buffett's original fixed thresholds. You can see how the market digested past extremes in our what-if investment calculator.
Sun Valley, 1999: the warning before the crash
At the 1999 Allen & Company conference in Sun Valley, Warren Buffett challenged the assumption that extraordinary stock returns could outrun the economy indefinitely. Fortune developed the argument that November, and Barron’s put Buffett’s caution on its December 27 cover. The Nasdaq collapse that followed did not make the ratio a market-timing clock, but it made the market-cap-to-output comparison part of the investing vocabulary. The lesson is about expectations and valuation, not a claim that one speech caused the downturn.
What counts as overvalued?
In the original 2001 Fortune article, Buffett offered rough zones: if the ratio falls to the 70–80% area, buying stocks "is likely to work very well," while a ratio approaching 200% — as in 1999–2000 — means investors are "playing with fire." Modern models adjust those goalposts upward because the ratio has trended higher for decades: globalization means US-listed companies earn abroad (revenue that never appears in US GDP), more of the economy's profits flow to listed companies, and interest rates spent years far below historical norms. Current Market Valuation, for instance, treats ~120% as "fair" for the 2020s rather than 100%. Even against that rising trend line, today's market sits about two standard deviations expensive.
Limits and criticisms
The Buffett indicator is a valuation gauge, not a crash timer — by most tracked versions it has signaled "overvalued" continuously for roughly a decade while the S&P 500 kept setting records. Its three main blind spots: it ignores interest rates (high valuations were partly rational when bonds yielded little); it compares increasingly global corporate revenues against purely domestic GDP; and it says nothing about which stocks carry the excess — in 2026 the concentration sits heavily in AI-linked mega-caps. Advisor Perspectives is blunt on this point: the indicator "remains ineffective for short-term market timing." Elevated readings have historically correlated with lower long-run returns, not with imminent declines.
What is Buffett himself doing?
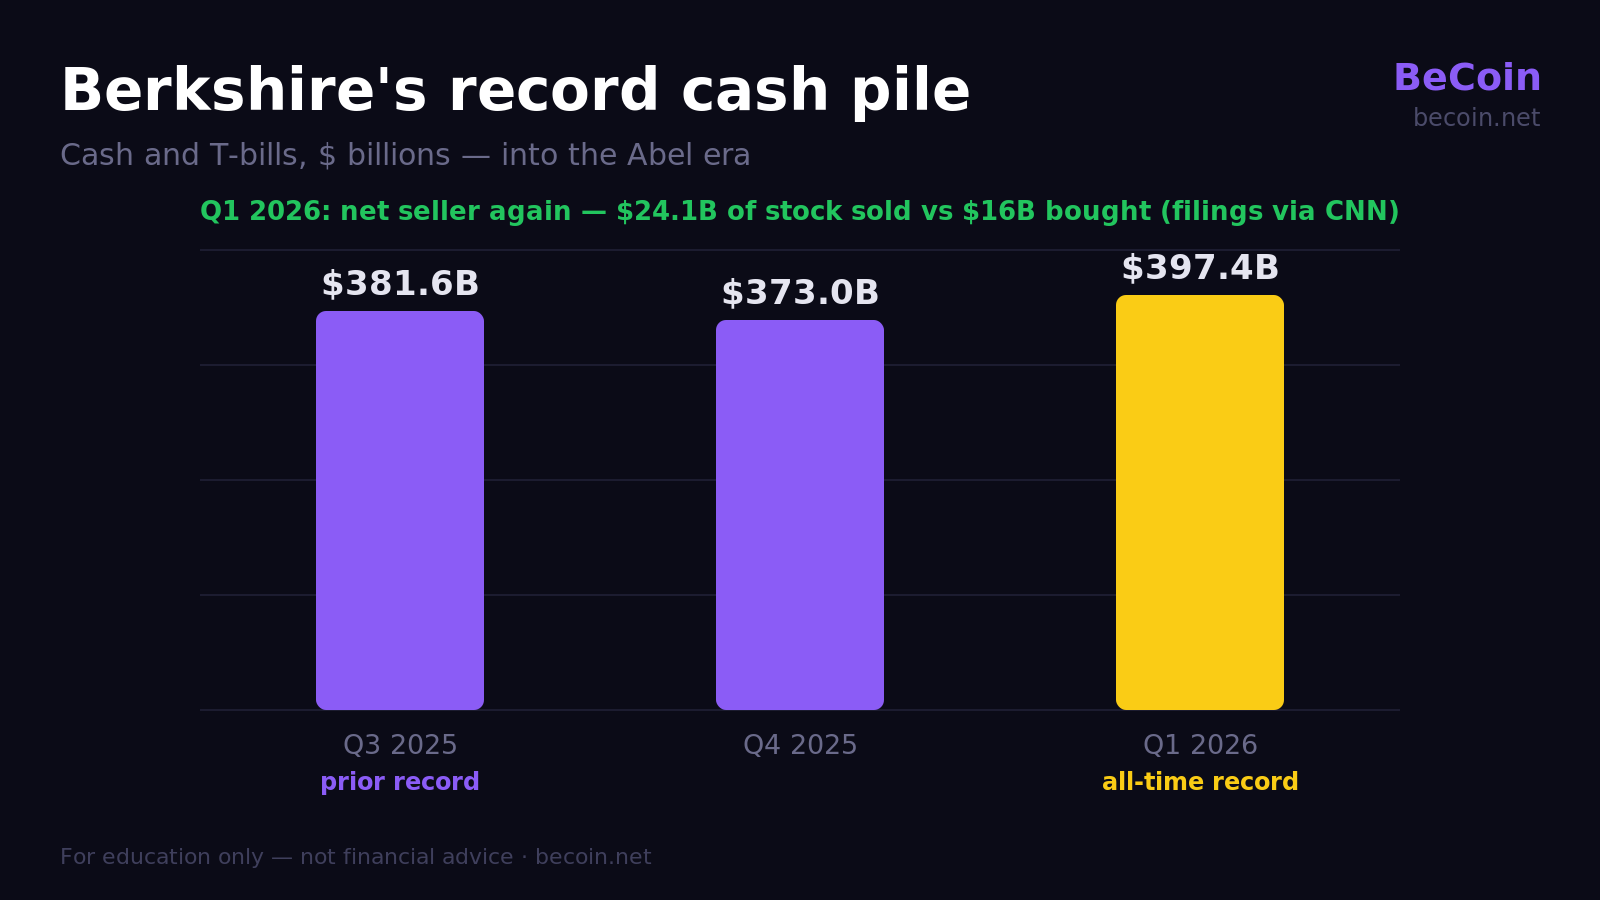
Berkshire Hathaway entered the first Greg Abel-era quarter with a record $397.4 billion of cash and Treasury bills, according to company reporting summarized by CNN in May 2026. Berkshire was a net seller of about $24.1 billion of stocks, versus roughly $16 billion in the prior period. That does not prove Buffett is calling an imminent top, but it does show a high preference for liquidity while broad US valuation measures remain stretched.
What it means for investors
A 218% reading does not tell you to sell on Monday. It tells you that the market's starting valuation is historically extreme, which in the past has meant thinner long-term returns and deeper drawdowns when sentiment turns. Practical takeaways: diversification and position sizing matter more at extremes; dollar-cost averaging removes the (unwinnable) timing decision; and single indicators should be cross-checked — against earnings-based measures, rates and market breadth. You can follow individual assets across stocks, crypto, forex and commodities with BeCoin's AI forecasts, explore the full market picture on the forecast hub, or stress-test your own scenarios with our free trading tools.
FAQ
What is the Buffett indicator right now?
About 218% on the quarterly Fed-data basis (Q1 2026, published July 8, 2026), roughly 214% on the Wilshire-to-concurrent-GDP basis, and around 238% on daily trackers that use live market cap against last-reported GDP.
What is a normal Buffett indicator value?
Historically around 75–90% was considered reasonable, per Buffett's 2001 comments. Because the ratio trends upward over time, modern trend-adjusted models put "fair value" for the 2020s near 120%.
Is the stock market overvalued in 2026?
By the Buffett indicator, yes — every major version of the measure sits at or near record highs and roughly two standard deviations above its long-term trend. But the indicator has been "overvalued" for most of the past decade, so it is a caution light, not a sell signal.
Why did Warren Buffett stop endorsing the indicator?
He has cautioned that no single measure is comprehensive or consistent across eras. Structural changes — global revenues, low rates, changing market composition — mean the ratio's "normal" level drifts upward over time.
Has the Buffett indicator ever been this high before?
No. Readings in the 214–238% range during 2025–2026 exceed both the dot-com peak (~140% on the same Wilshire basis) and the 2021 "everything bubble" peak (~190–200%).
Methodology and sources
Current readings: Advisor Perspectives / dshort "Buffett Valuation Indicator: June 2026" (published July 8, 2026; 218.1% Fed-data basis, 214.1% FT Wilshire basis, 56.6% above trend); Current Market Valuation Buffett Indicator model (March 31, 2026; 219% = $69.15T market value ÷ $31.57T annualized GDP, ~2.1 standard deviations above trend); daily estimates from live trackers retrieved mid-July 2026 (~238%). Historical values: Wikipedia's Buffett indicator entry (Wilshire vs Fed-basis 2000 peaks, 2007 peak, 2009 low) and contemporaneous 2021 coverage (189.6% in February 2021). Buffett's original commentary: Fortune, December 2001. Underlying data: FRED (Fed Z.1 corporate equities, GDP), Wilshire Associates, BEA. GDP figures are revised after publication; all readings are dated snapshots.
This article is for educational purposes only and is not financial advice. Valuation indicators describe conditions; they do not predict returns.
Track valuations, forecasts and signals across every major market in one place. Get full access to all 100+ assets →

Deriv vs IQ Option for Synthetic Indices: Which Platform Is Better in 2026?
Synthetic indices have become one of the most talked about trading categories among beginners and experienced traders alike. Unlike forex or crypto markets that depend on real world events, synthetic indices operate 24/7 using algorithm driven price movements. That means traders can access opportunities at any time without waiting for market openings or major news […]

How Liquidity Affects Binary Options Results
When I first started trading binary options, I believed success was all about finding the perfect indicator. I spent weeks testing moving averages, RSI settings, support and resistance levels, and dozens of YouTube strategies that promised easy wins. Some worked for a few trades, but most failed. What confused me was that the same setup […]

Best Broker for Learning Price Action in 2026 (Tested by Real Traders)
Most traders think they need a better strategy. What they actually need is a better understanding of price. A few years ago, one of our community members had over ten indicators on his chart. RSI. MACD. Moving averages. Bollinger Bands. Stochastic. Every new YouTube video added another indicator. The result? More confusion. Not more profits. […]

Binomo vs IQ Option for Small Accounts: Which Platform Is Better for Beginners in 2026?
Most people entering online trading do not start with thousands of dollars. They start small. Usually with $10, $20, or maybe $50. That small balance changes everything about how a trader behaves. Every loss feels bigger, every win feels emotional, and every mistake has a stronger impact on the account. This is exactly why beginner […]
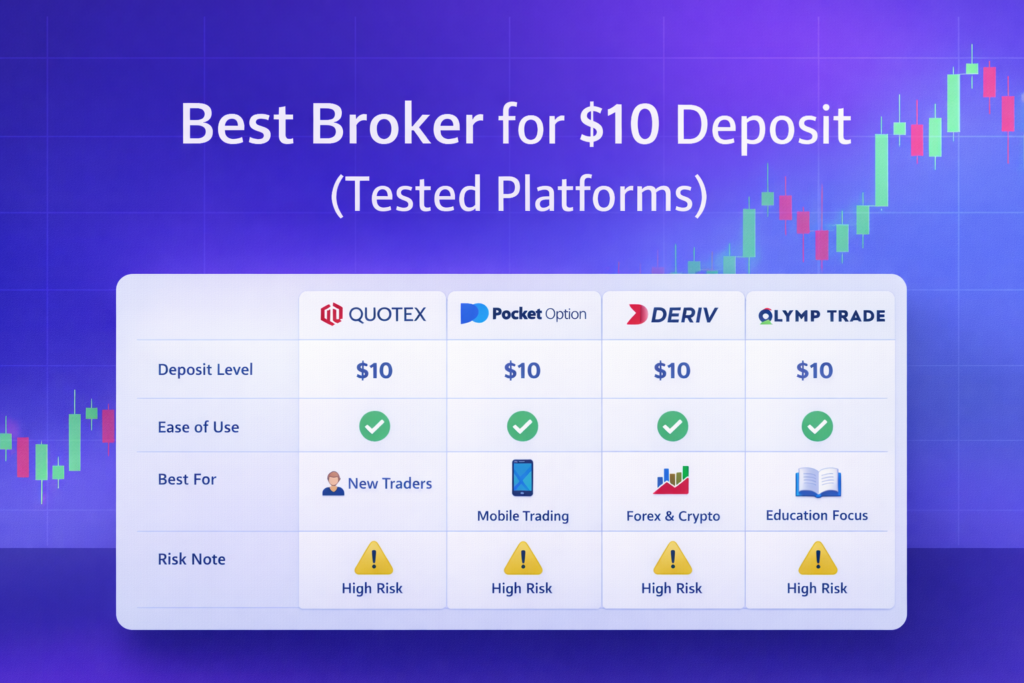
Best Broker for $10 Deposit (Tested Platforms – 2026)
If you are starting with a $10 deposit, choosing the wrong broker will cost you more than the market itself. Most platforms look similar, but execution speed, withdrawal behavior, and usability are very different in practice. This page is designed to help you make a fast, clear decision. No unnecessary details. Only tested platforms that […]

EUR/USD holds 1.1414 before the ECB decision: three scenarios
EUR/USD traded near 1.1414 before the ECB’s July decision. Here is what a hold, hawkish hold or surprise hike could mean for 1.1350 and 1.1480.