US 10-year yield closes near 4.679% with 4.80% still the key test
# US 10-year yield closes near 4.679% with 4.80% still the key test
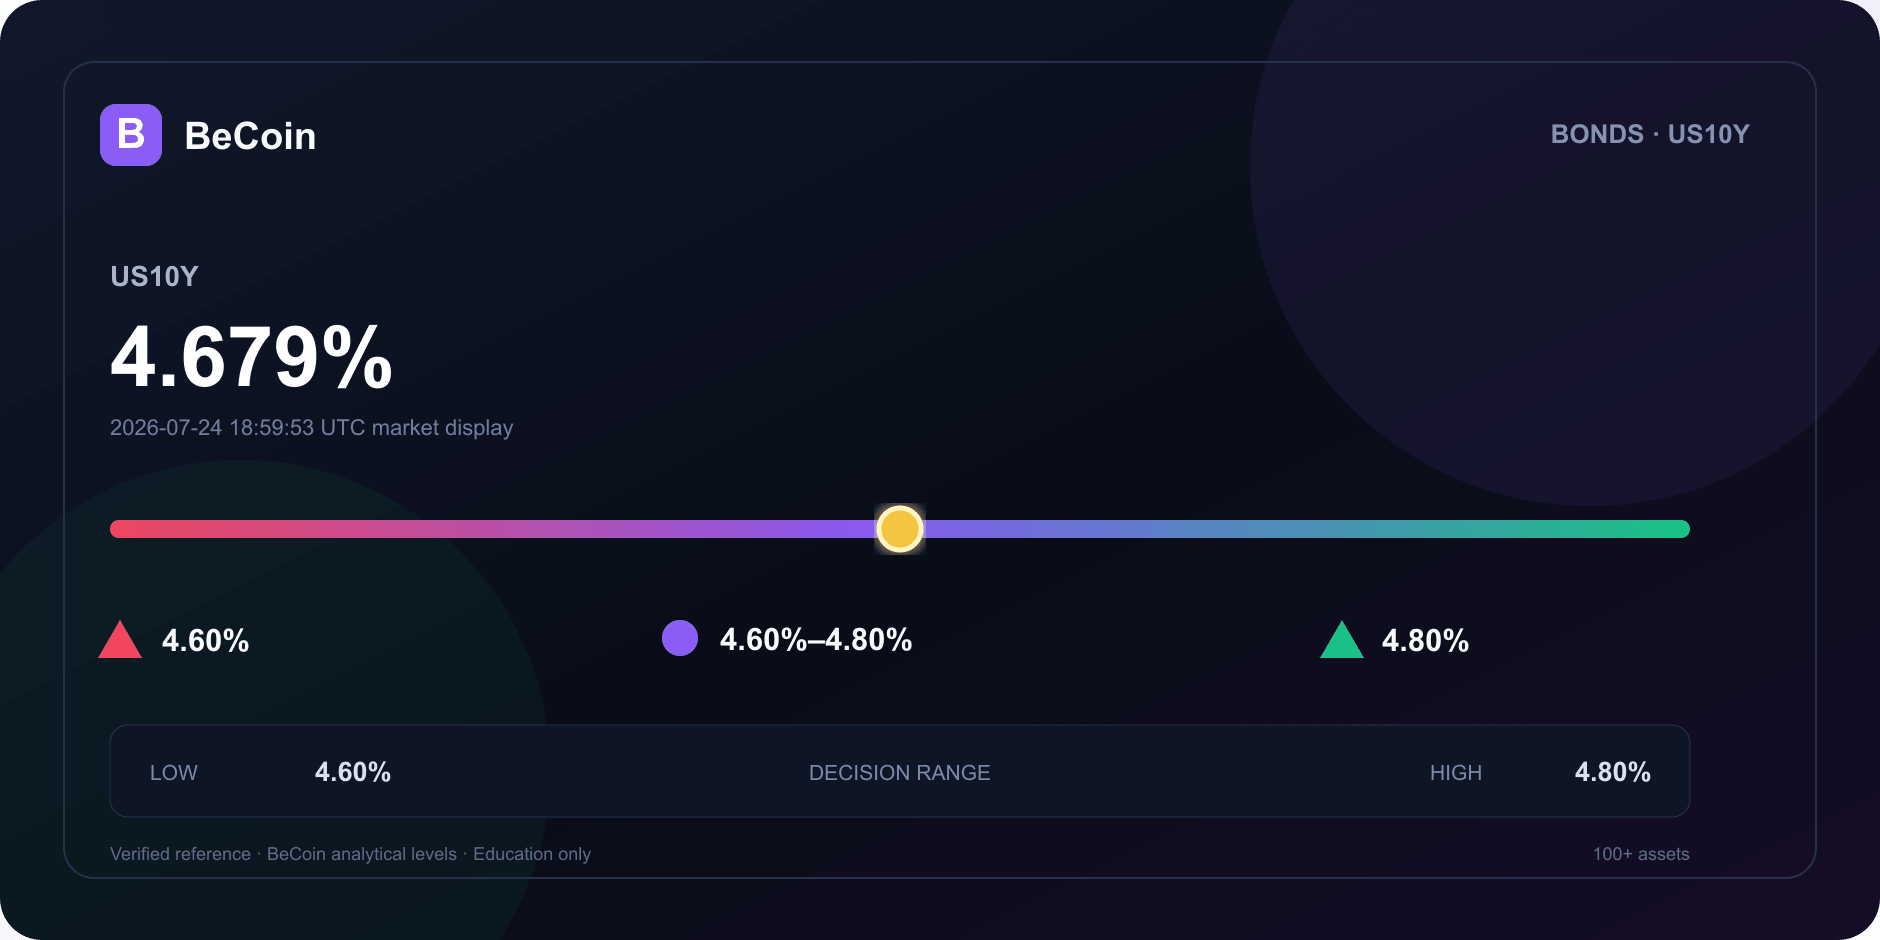
The US 10-year Treasury yield currently stands at 4.679%. This level is significant as it approaches the key resistance level of 4.80%. The market debate centers around whether the yield can break through this resistance or if it will revert to the lower boundary of 4.60%.
Why it matters
The US 10-year Treasury yield is a critical indicator of market sentiment and economic health. It influences borrowing costs and is closely watched by investors and policymakers alike. The current yield reflects investor expectations regarding future interest rates and inflation. The distinction between the July 24 market close and the Federal Reserve's latest visible July 23 constant-maturity value of 4.71% highlights the ongoing discussions about the potential direction of yields. BeCoin's analysis treats the 4.80% level as conditional, indicating that market dynamics may shift based on upcoming economic data and Federal Reserve policy decisions.
Technical and market context
Recent data shows that the US 10-year Treasury yield was displayed at 4.679% as of July 24, 2026, down 0.51% in the Cboe index display. The day range for the yield has been noted between 4.60% and 4.80%. The Federal Reserve H.15 table, visible on July 26, listed the 10-year constant maturity at 4.71% for July 23. This discrepancy between the market display and the official data can lead to varying interpretations among investors. Recent TradingView US 10-year ideas discussed the possibility of renewed upside and a roadmap above 4.80%. These are contributor opinions, not verified targets, which adds another layer of complexity to the current market analysis.
BeCoin forecast read
The forecast for the US 10-year Treasury yield can be viewed through two scenarios. In a bullish scenario, if the yield breaks above the 4.80% resistance, it may signal a stronger upward trend, potentially leading to higher yields in the near term. Conversely, in a bearish scenario, if the yield fails to maintain its position above 4.679% and drops towards the 4.60% level, it may indicate a retreat in investor confidence and a shift in market sentiment. The current analysis suggests that the market is at a critical juncture, and the next moves will depend on economic indicators and Federal Reserve actions.
Methodology and sources
This analysis is based on the latest market data and insights from various sources. Key references include the Google Finance quote, which provided the current yield figure, and the Federal Reserve H.15 table, which offers official constant maturity values. Additionally, insights from TradingView ideas contribute to understanding market sentiment and potential future movements.
Related market analysis · Related BeCoin tool
| Evidence field | Value |
|---|---|
| Verified reference | 4.679% |
| Source time | 2026-07-24 18:59:53 UTC market display |
| Base range | 4.60%–4.80% |
| Bull confirmation | 4.80% |
| Bear confirmation | 4.60% |
This content is for education only and is not financial advice.
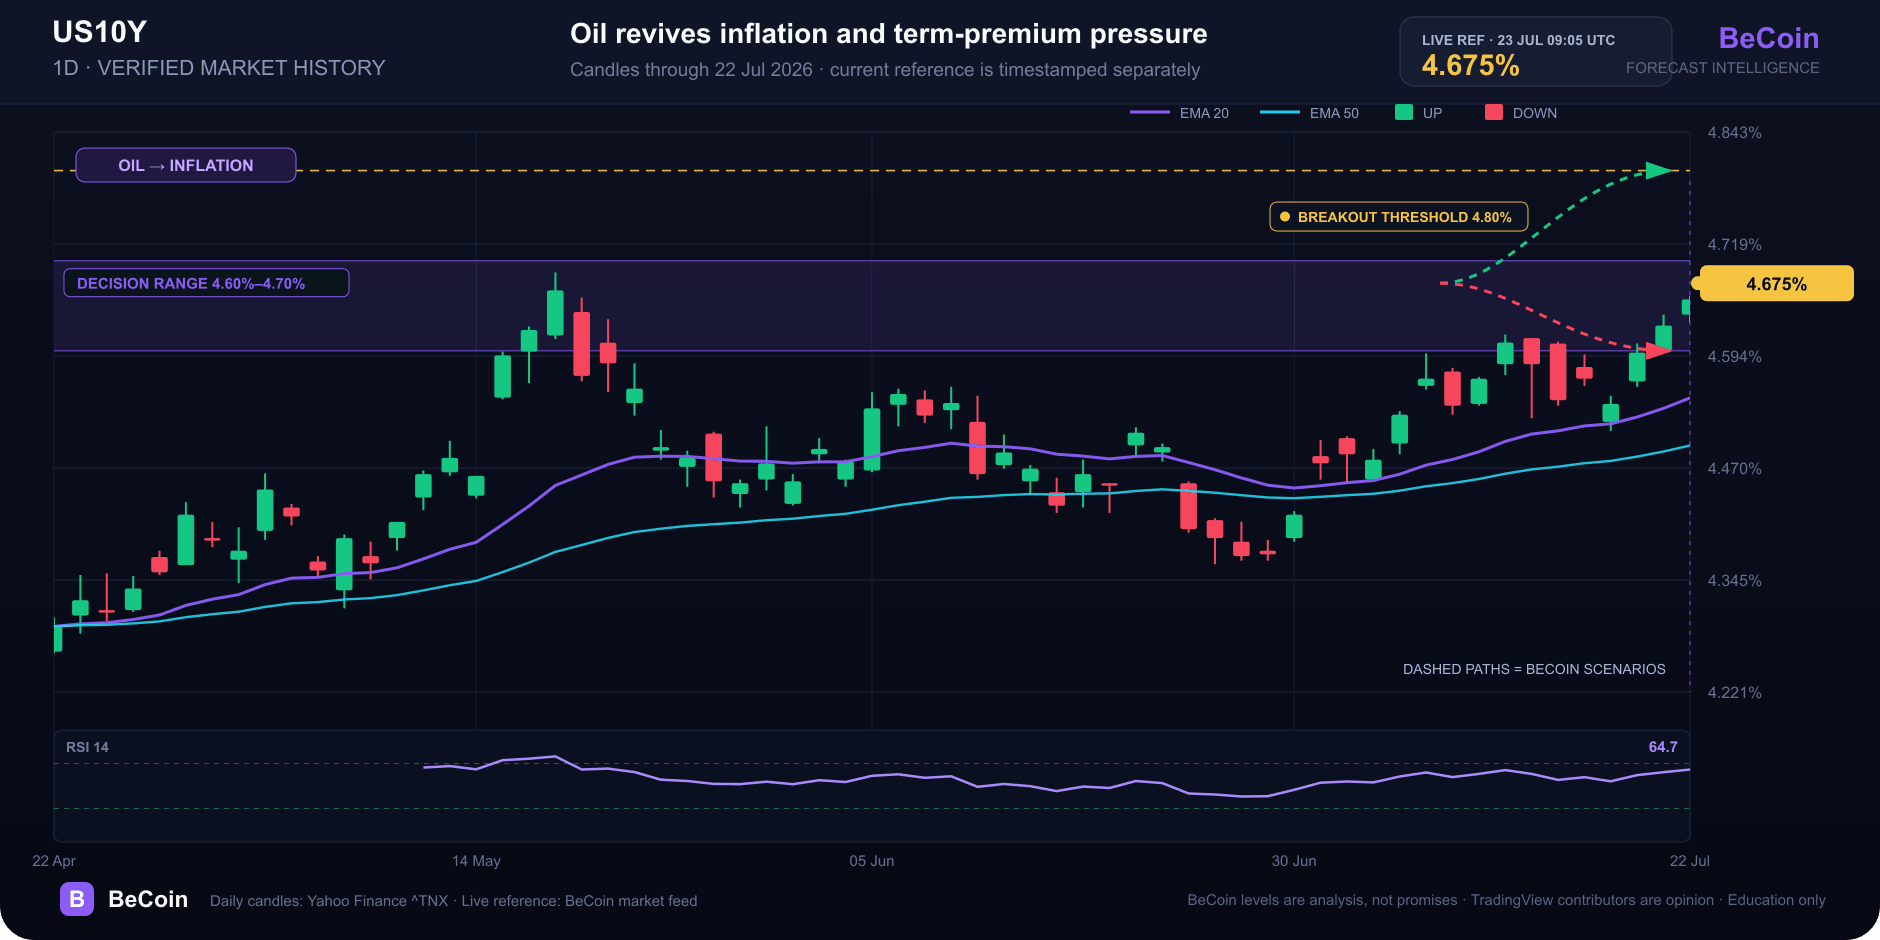
US 10-year yield reaches 4.675% as oil revives inflation pressure
The US 10-year yield reached 4.675% as oil prices rose and markets awaited labor data. What 4.70%, 4.80% and a reversal below 4.60% would mean.

WTI reaches $89.43 as Brent clears $95 on renewed supply risk
WTI traded near $89.43 while Brent moved above $95 as Middle East shipping risk lifted crude for a fifth session. Key levels, catalysts and invalidation.

Bitcoin slips to $65,741 as oil and yields test the breakout
Bitcoin is near $65,741 as rising oil and Treasury yields test the $65.7K breakout floor. Here are the levels that confirm or invalidate the move.

The Clock and the Cash: My Journey into the Hidden Rhythm of Session-Based Trading
There was a time when I thought the global financial market was a single, monstrous wave that never stopped moving. I believed that if I sat in front of my monitors long enough, clicking buttons whenever a pretty pattern appeared on my charts, the market would eventually reward my sheer endurance. I was dead wrong. […]

The Clock and the Candle: How I Stopped Guessing the Best Time to Trade Binary Options
I still remember the night I blew my third trading account. It was 11:30 PM. The house was completely quiet, the market charts on my screen were barely crawling, and I was forcing trades out of pure impatience. I kept staring at a flatline asset, placing one-minute positions, convinced that the market owed me a […]

Is Binomo Safe or Risky in 2026? A Practical User Checklist (Not a Generic Review)
I still remember the first time I opened Binomo. It wasn’t excitement. It was hesitation. I had already read multiple reviews. Some said it was safe. Others called it risky. None of them felt like they came from someone who had actually traded, deposited, withdrawn, and dealt with real friction. So I decided to test […]