10-year at 4.57%, 2s10s at +41bp: the curve is steepening into a hiking Fed
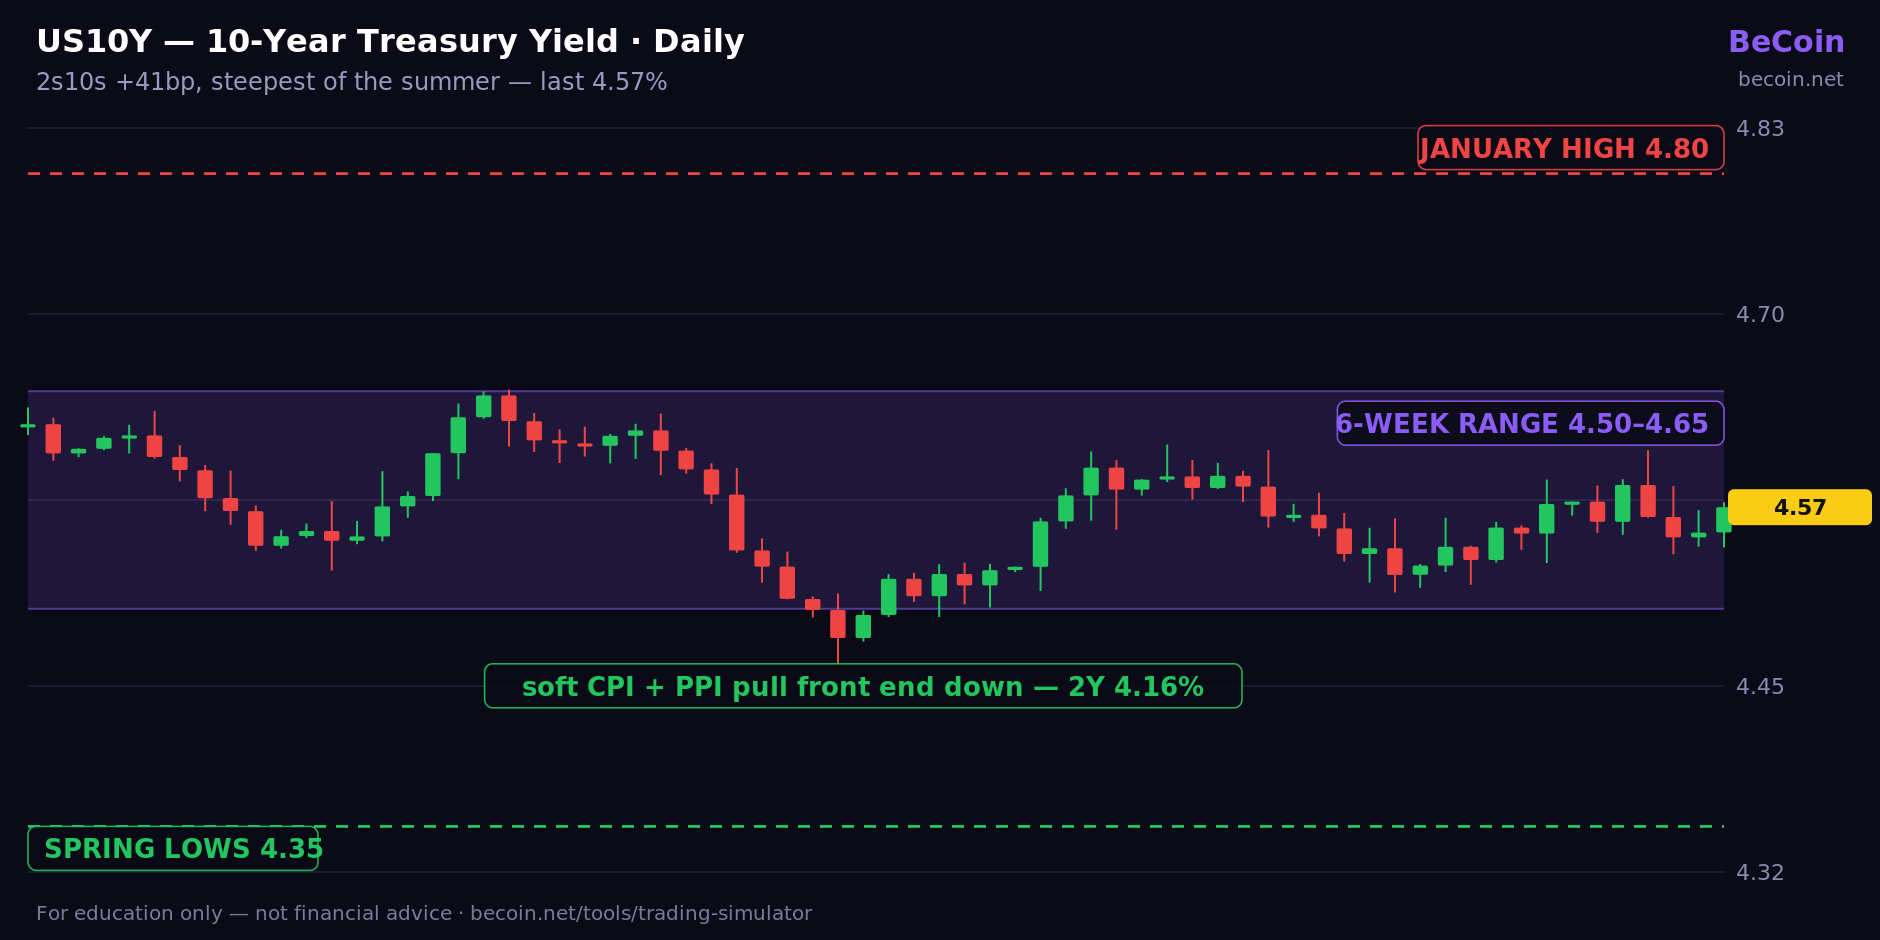
The 10-year Treasury yield held near 4.57% this week while the 2-year eased to 4.16%, leaving the 2s10s curve at +41 basis points — its steepest reading of the summer. The move came as both CPI and PPI printed softer than expected, even while Fed officials kept a rate hike on the table and oil traded above $80.
Why it matters
The curve is telling a more interesting story than either yield alone. The front end is falling because soft inflation data undermines the case for the hike the market has been pricing all year. The long end refuses to follow because $80 oil, fiscal supply, and a Fed chair testifying about upside inflation risks keep term premium bid. A steepener driven by front-end relief is historically the friendly kind for risk assets — it eases financial conditions without signaling recession — which is part of why equities sit within a percent of records despite the hike talk. The trade breaks if the long end starts rising for the wrong reason: an oil spike through $90 would turn this from a relief steepener into an inflation steepener fast.
Technical analysis
The 10-year has spent six weeks in a 4.50–4.65% range, and 4.57% is dead center — no edge at the level itself. The range edges are the trade: a break below 4.50% (which soft data is now arguing for) targets the spring lows near 4.35%, while a close above 4.65% puts the January high near 4.80% back in view. The 2-year's break below 4.20% is the cleaner trend — three lower highs since June. Watch the +41bp spread: the steepening accelerates through +50bp if the Fed blinks on the hike, and flattens back toward +25bp on any hawkish surprise.
BeCoin's forecast read
The model's weekly path for the 10-year is mildly lower — it weights the soft CPI/PPI pair more heavily than the rhetoric — with 4.50% the level that converts drift into trend. Its month view keeps a wide distribution: the oil tail is real, and the model treats a Hormuz-driven energy shock as the scenario that re-prices the long end 20bp in a week. Yield forecasts across the Treasury curve update daily on the BeCoin forecast page.
See where it goes next. BeCoin's AI model forecasts Treasury yields across six horizons — tomorrow to 10 years — and fires signals the moment they trigger. Get full access to all 100+ assets → · Educational only — not financial advice.

The Clock and the Cash: My Journey into the Hidden Rhythm of Session-Based Trading
There was a time when I thought the global financial market was a single, monstrous wave that never stopped moving. I believed that if I sat in front of my monitors long enough, clicking buttons whenever a pretty pattern appeared on my charts, the market would eventually reward my sheer endurance. I was dead wrong. […]

Which Broker Is Better for Weekend Trading?
It was a chilly Saturday morning, and while the rest of the world was sleeping in or catching up on shows, I was staring at a completely frozen screen. My usual EUR/USD chart looked like a heart monitor flatlining. The traditional markets were closed. The banks were shut down. For a long time, that was […]

Bitcoin slips to $65,741 as oil and yields test the breakout
Bitcoin is near $65,741 as rising oil and Treasury yields test the $65.7K breakout floor. Here are the levels that confirm or invalidate the move.

Finding the Best Trading Broker for Side Income: My Raw, First-Hand Journey to Consistent Daily Wins
Six months ago, I sat at my kitchen table staring at an accumulation of household bills, realizing my primary salary was no longer cutting it. I didn’t want a second job that required clocking into a physical location or taking endless boss mandates after hours. I needed a flexible, scalable side income. That night, I […]

Finding My Perfect Workspace: The Search for the Best Broker for My Daily Trading Routine
The alarm goes off at 6:00 AM. By 6:30 AM, I am sitting in front of my monitors with a steaming mug of black coffee. The house is completely quiet, the market is preparing its next major move, and my charts are completely bare. This is my daily sanctuary. For a long time, this morning […]
Best Broker for One Trade a Day Strategy in 2026
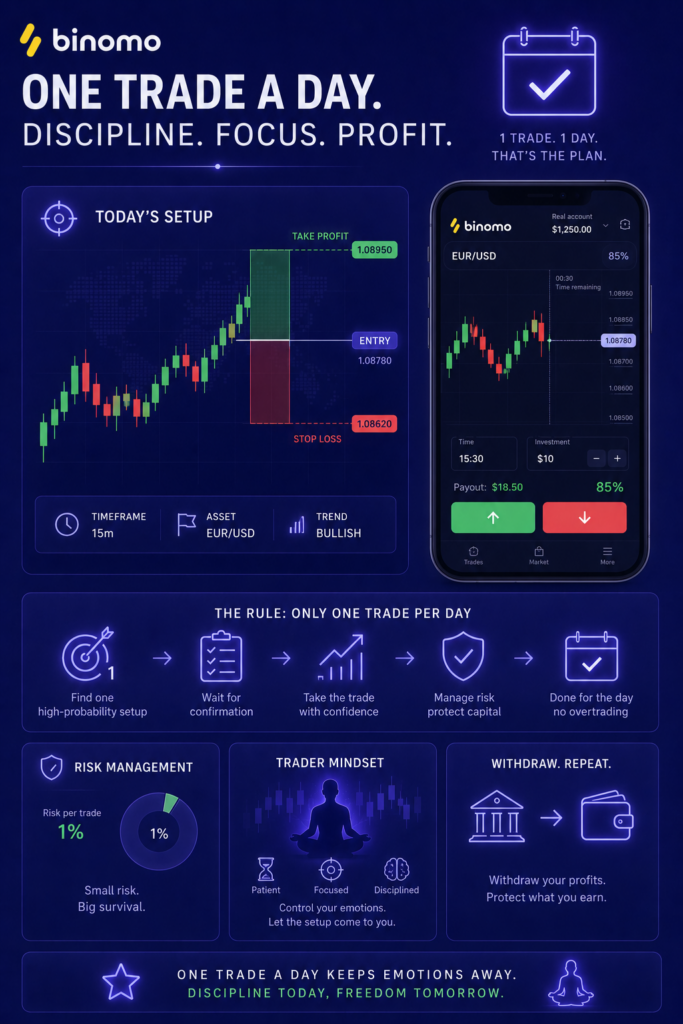
Most traders lose money because they trade too much. They enter random setups, chase candles, overreact emotionally, and turn a simple strategy into pure gambling. That is exactly why the one trade a day strategy is becoming more popular among smart traders in 2026. Instead of sitting in front of charts all day, this approach […]