TSLA Stock Forecast: 351 Rebound Meets the 358 Average
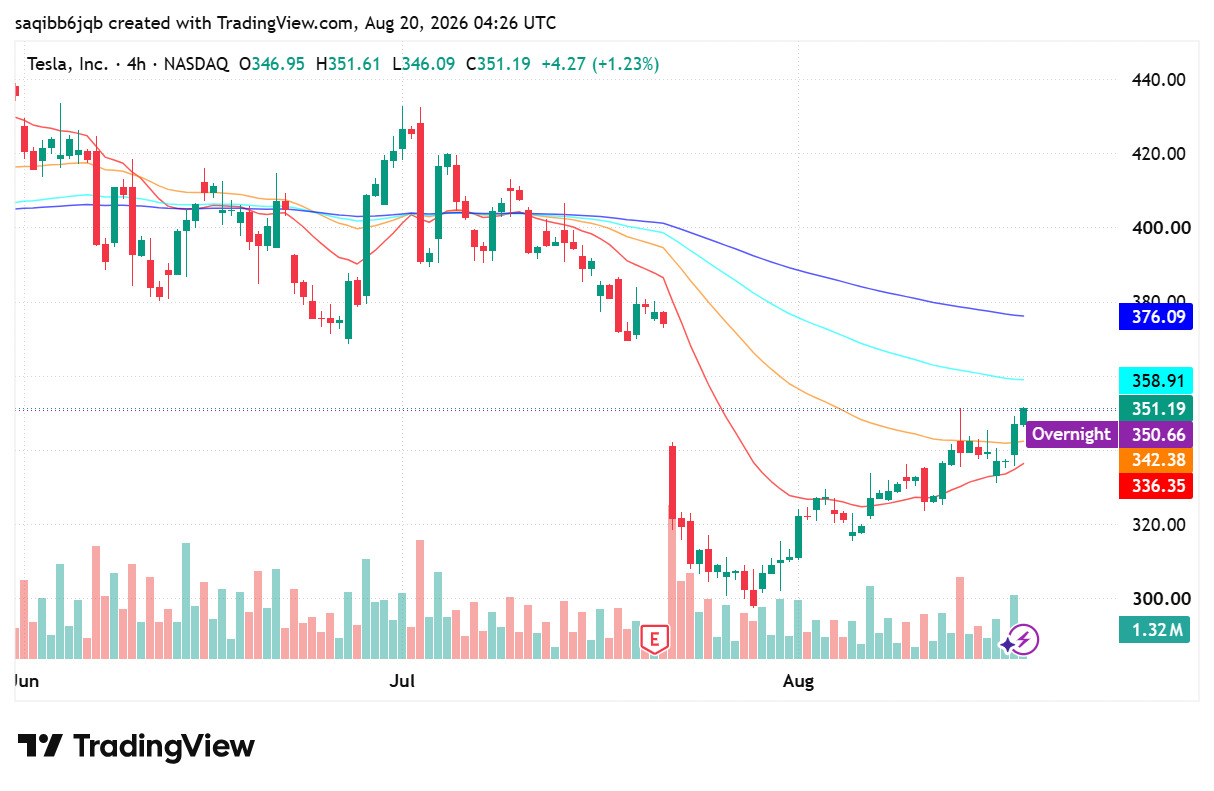
- TSLA trades at 351.12, up 4.23% on the day and pressing into the first serious resistance of its rebound.
- Record deliveries met a missed profit line: revenue beat, earnings did not, and free cash flow was negative.
- 358.91 is the level that decides whether this recovery has another leg.
Fundamental Analysis: TSLA
The 22 July second-quarter report split cleanly in two. Revenue of $28.24bn beat the roughly $26.4bn expected, and deliveries of just over 480,000 vehicles were up around 25% year on year against street estimates nearer 400,000 - a substantial beat achieved after the federal EV tax credit had gone.
The profit line went the other way. Adjusted earnings of $0.33 per share missed the $0.53 consensus, and free cash flow came in at negative $1.09bn. Selling more cars at thinner margins while spending heavily on capacity, autonomy and robotics is a deliberate choice, but it means the volume story and the earnings story are pointing in different directions for now.
That is why the stock fell first and recovered later. The delivery number told investors demand is intact without the subsidy, which is the existential question answered; the margin number told them the payoff is still deferred. With the Fed minutes on 19 August signalling no rush to ease, deferred payoffs are worth less, and the rebound has had to be earned rather than gifted.
Technical Analysis: TSLA
The move that set the structure was the post-earnings collapse in late July, which took the stock from roughly 390 to a low near 310 in the first week of August. Since then it has been a persistent grind higher, with price clearing the 336.35 and 342.38 averages and now trading at 351.12, directly beneath the 358.91 average that marks the top of the damage zone.
Resistance is 358.91 first, then the 376.09 long-term average that capped the stock before earnings. Support is the 342.38 average just reclaimed, then 336.35, with the 310 August low the floor beneath. A four-hour close back below 336 would end the recovery read and put that low back in play.

Best Capital Core Day Trading Strategy for 1-Minute and 5-Minute Trades
I did not build my short-expiry strategy on Capital Core from a perfect week, a flashy YouTube setup, or some “secret indicator” thread. I built it by making the same mistakes most traders make when they first touch 1-minute and 5-minute day trading. I entered too early. I forced trades because the candles looked exciting. […]

Alphabet falls to $329.71 premarket as AI spending eclipses cloud growth
Alphabet traded near $329.71 premarket after strong Q2 revenue and cloud growth collided with a much larger AI spending plan. What investors need to watch.

How Liquidity Affects Day Trading Results
When I first started trading day trading, I believed success was all about finding the perfect indicator. I spent weeks testing moving averages, RSI settings, support and resistance levels, and dozens of YouTube strategies that promised easy wins. Some worked for a few trades, but most failed. What confused me was that the same setup […]

The Clock and the Candle: How I Stopped Guessing the Best Time to Trade Day Trading
I still remember the night I blew my third trading account. It was 11:30 PM. The house was completely quiet, the market charts on my screen were barely crawling, and I was forcing trades out of pure impatience. I kept staring at a flatline asset, placing one-minute positions, convinced that the market owed me a […]

The Day I Stopped Trading and Finally Started Making Money
It was a rainy Tuesday morning, and I was staring at my screen with a familiar knot in my stomach. The previous three days had been a slow, agonizing slide into the red. I had given back two weeks of hard-earned profits in less than seventy-two hours. Every asset I clicked on looked like a […]

Finding the Best Trading Broker for Side Income: My Raw, First-Hand Journey to Consistent Daily Wins
Six months ago, I sat at my kitchen table staring at an accumulation of household bills, realizing my primary salary was no longer cutting it. I didn’t want a second job that required clocking into a physical location or taking endless boss mandates after hours. I needed a flexible, scalable side income. That night, I […]