
TSLA Forecast: 376.37 Jumps 5.4% on Robotaxi Cap Lift
- TSLA trades at 376.37, up 5.42% on the day, after tagging 383.27 in the strongest session of the week.
- Nevada lifting the Clark County robotaxi cap from 10 vehicles to 5,000 is the catalyst behind the move.
- The 372.21 average is now the level that decides whether this holds as a breakout.
Fundamental Analysis: TSLA
August was Tesla's month: the shares rose 18.2%, and the September follow-through has extended it. The trigger is regulatory rather than financial. Nevada lifted the cap on robotaxi vehicles in Clark County from 10 to 5,000, a five-hundred-fold increase in permitted fleet size in a single jurisdiction, and it landed alongside a Cybercab launch event and safety data on unsupervised operation that held up to scrutiny.
The counterweight is that the story has been repriced faster than it has been delivered. Only six cities had unsupervised robotaxis operating by the middle of 2026, against a stated ambition of dozens of major cities by year end. The second-quarter report showed margin compression driven by exactly this programme — robotaxi development costs, incentive spending and AI investment — so the near-term earnings effect of the expansion is negative before it is positive. At a $1.4 trillion market capitalisation, a good deal of the eventual payoff is already in the price.
What has changed, and what explains why the market is paying up anyway, is the metric being tracked. The narrative has shifted from fleet size and city count, where Tesla has missed, to full self-driving v15 and miles driven under unsupervised operation, where the data is improving. Permission to scale to 5,000 vehicles matters far more for miles accumulated than for near-term revenue. That is a defensible reason for the move, provided the miles actually arrive.
Technical Analysis: TSLA
The 4-hour chart shows a base-and-breakout structure. Price built a rising channel from the low 320s through August, with the moving averages fanning out in bullish order beneath it, then pushed through the top of that channel on the robotaxi news and printed 383.27 before settling at 376.34. The averages sit at 372.21, 358.16, 357.29 and 351.26 — all below spot, all rising.
Resistance is the 383.27 session high, and above it the round 400 level. Support is 372.21 at the nearest average, then the 369.98 overnight reference, with the 357-358 cluster marking the top of the old channel. A 4-hour close below 369.98 would put the breakout in question and invalidate the bullish read.

Which Broker Has the Cleanest Interface? Real Comparison for Beginners in 2026
Looking for the cleanest trading interface in 2026? Compare Binomo, IQ Option, Quotex, Deriv, and more based on speed, layout, usability, mobile experience, and beginner friendliness. When most beginners choose a broker, they focus on bonuses, payouts, or deposit methods. But after testing multiple platforms for months, I realized something surprising: A messy interface can […]

Which Broker Has Faster Withdrawals? Real 2026 Comparison for Traders
When most beginners choose a broker, they focus on bonuses, signals, or flashy interfaces. But after trading for a while, you realize one thing matters more than almost anything else: How fast can you actually withdraw your money? A broker can look perfect until your first withdrawal request gets stuck in “processing” for three days. […]
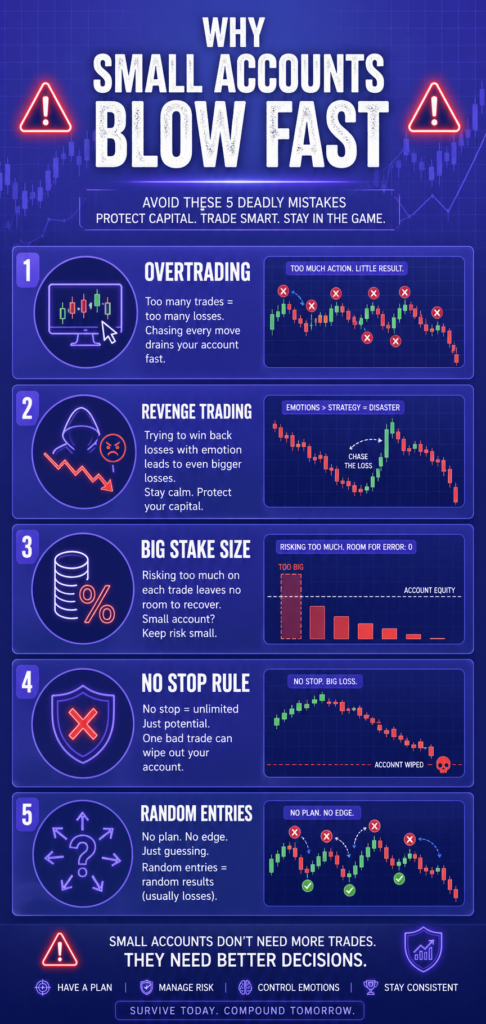
Risk Management for Small Accounts ($10–$50)
Starting with a small trading account can feel frustrating. You want fast growth, but one bad decision can wipe out weeks of progress. That is why risk management matters more for a $10 account than for a $1,000 account. Many beginners focus only on strategy. They search for the best indicators, signals, or entry methods. […]

Deriv Volatility 75 Strategy Backtest: What Actually Works After 1,000 Trades?
The first time I tried trading Volatility 75, I thought I had found the perfect market. No news shocks. No central banks. Just clean, continuous price movement. Within two weeks, I blew my first account. That experience forced me to stop guessing and start testing. Instead of chasing indicators or copying strategies from forums, I […]

WTI reaches $89.43 as Brent clears $95 on renewed supply risk
WTI traded near $89.43 while Brent moved above $95 as Middle East shipping risk lifted crude for a fifth session. Key levels, catalysts and invalidation.

Alphabet falls to $329.71 premarket as AI spending eclipses cloud growth
Alphabet traded near $329.71 premarket after strong Q2 revenue and cloud growth collided with a much larger AI spending plan. What investors need to watch.