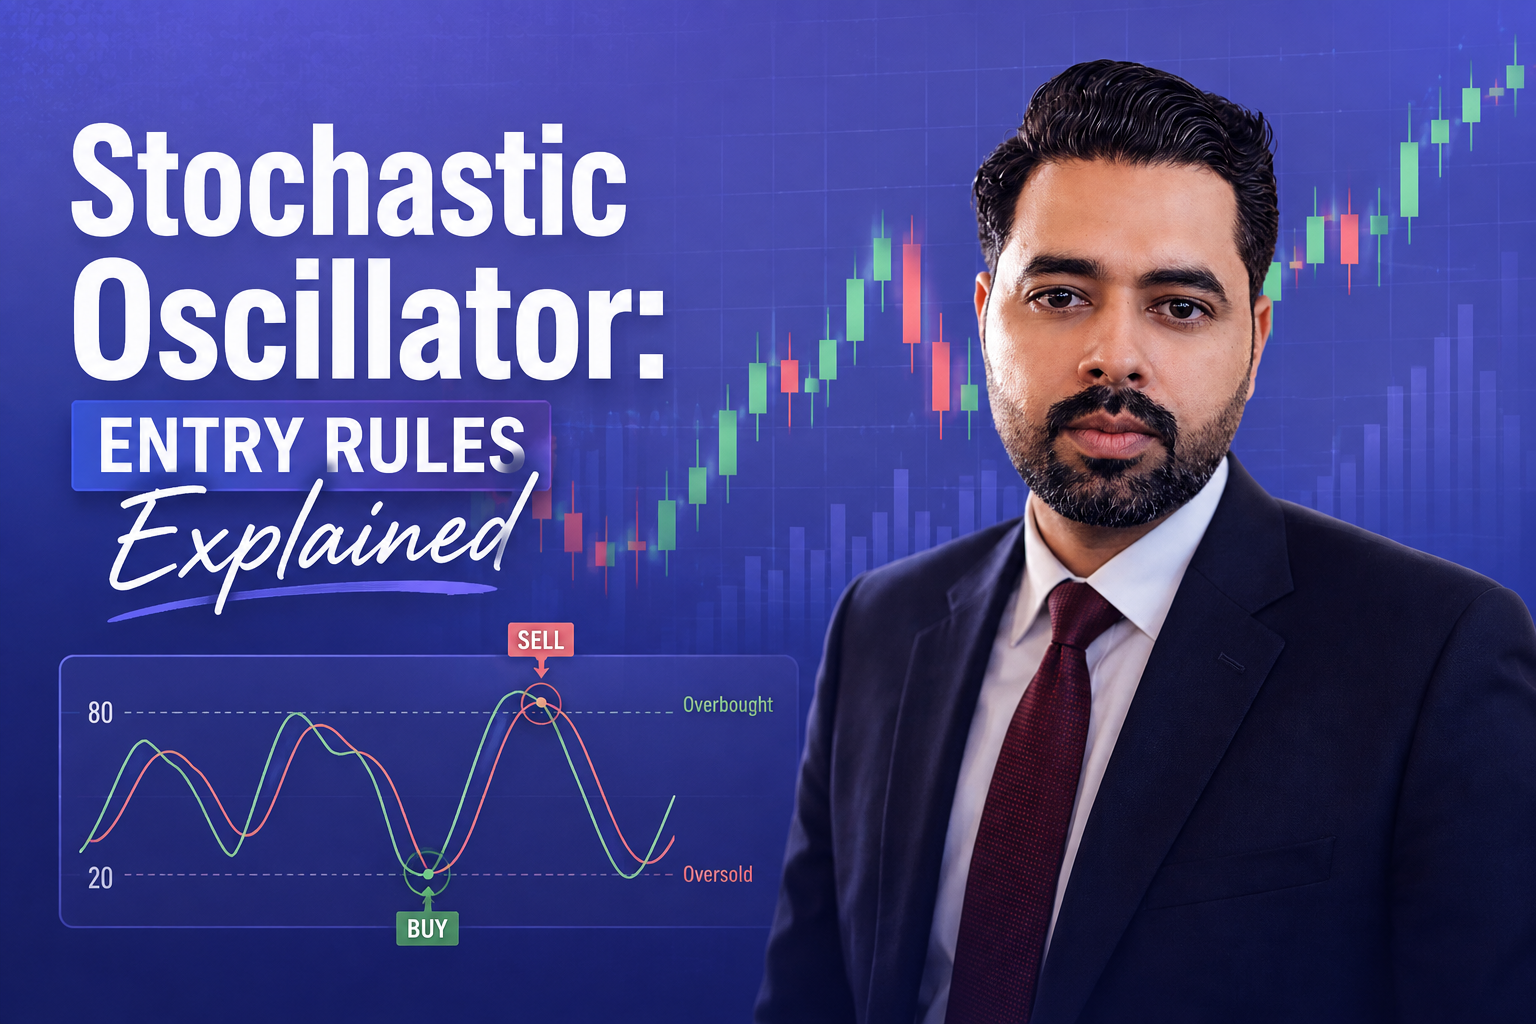
Stochastic Oscillator: Entry Rules Explained
When I first opened a trading platform years ago, my chart looked like an explosion in a neon paint factory. I had five moving averages, two trendlines, Fibonacci retracements, and a MACD indicator all fighting for attention. Every time I thought I saw a buy signal, the price reversed and wiped out my stop loss. I was constantly entering late, exiting early, and chasing every flickering candle.
Everything changed the day I decided to strip away the noise and truly master one tool: the Stochastic Oscillator. Created by George Lane in the late 1950s, this indicator is often misunderstood by beginners who treat it like a magic crystal ball. When I first loaded it onto my EUR/USD chart, I assumed that whenever the lines rose above 80, I should short the market, and whenever they dropped below 20, I should buy. That misconception cost me three consecutive trading accounts before I realized a fundamental truth: overbought does not mean sell, and oversold does not mean buy.
Once I cracked the actual entry rules behind momentum and price location, my trading transformed from gambling into a methodical business. Here is how I use the Stochastic Oscillator to pinpoint high-probability entries, avoid dangerous traps, and build consistency in live market conditions.
What the Stochastic Oscillator Actually Measures
To trade an indicator effectively, you must understand what it is calculating behind the scenes. Early in my journey, I thought the Stochastic Oscillator tracked price momentum directly. In reality, it tracks the momentum of speed.
George Lane famously observed that as price moves upward, the closing prices tend to accumulate near the high of the recent price range. Conversely, in a sharp markdown, closing prices gather near the bottom of that range. The Stochastic Oscillator measures where the current closing price sits relative to the highest high and lowest low over a designated lookback period, which is set to 14 periods by default.
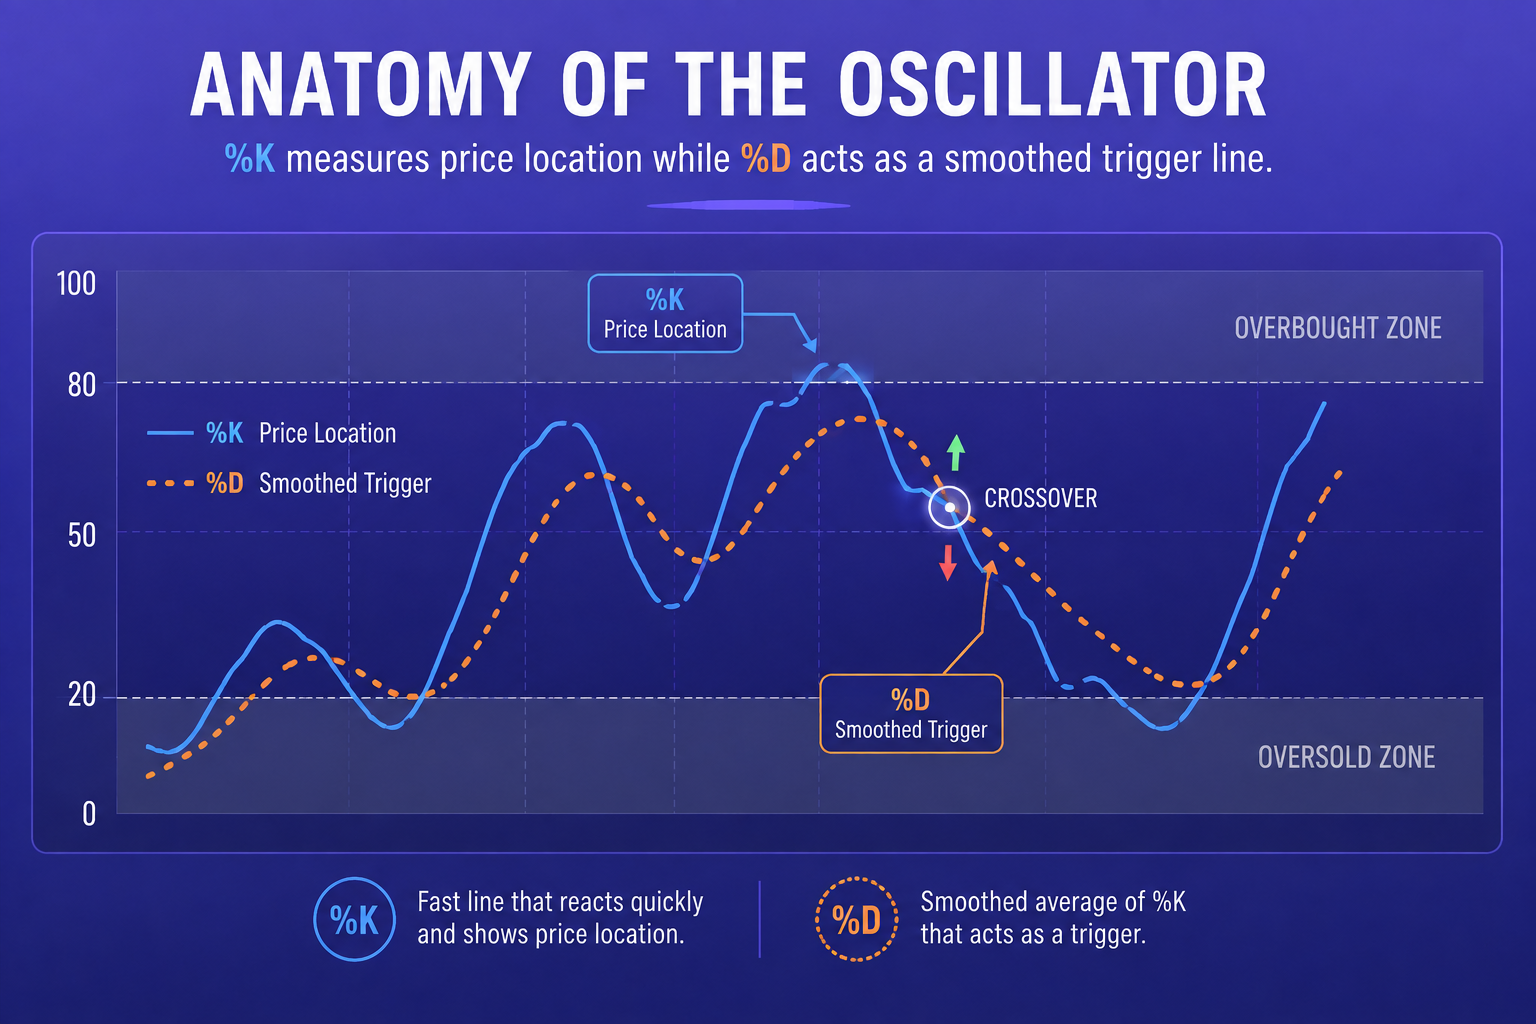
The indicator consists of two dynamic lines that oscillate between 0 and 100:
- %K Line (Fast Line): This compares the current closing price to the high-low range over the chosen lookback period. It reacts quickly to raw price action.
- %D Line (Slow Line): This is simply a 3-period simple moving average of the %K line. It smooths out market chatter and acts as your primary trigger line.
When you observe both lines moving together, you are watching the relative closing strength of the asset. The neutral mark sits at 50. Anything above 80 means price is closing near the top 20 percent of its recent range. Anything below 20 means the price is closing in the bottom 20 percent.
My 3 Rock-Solid Entry Rules for High-Probability Trades
Through years of testing across day trading, forex, and stocks, I narrowed down dozens of theoretical setups into three reliable entry rules. These rules prevent you from stepping in front of freight-train trends while allowing you to capture strong continuation and reversal moves.
Rule 1: The Zone-Exit Confirmation (Avoiding the Overbought Trap)
My biggest early mistake was shorting the asset the moment the Stochastic Oscillator crossed above 80. In a strong bullish trend, the oscillator can stay pinned above 80 for hours or even days while price continues to surge upward. Entering prematurely against a powerful trend is a fast track to liquidation.
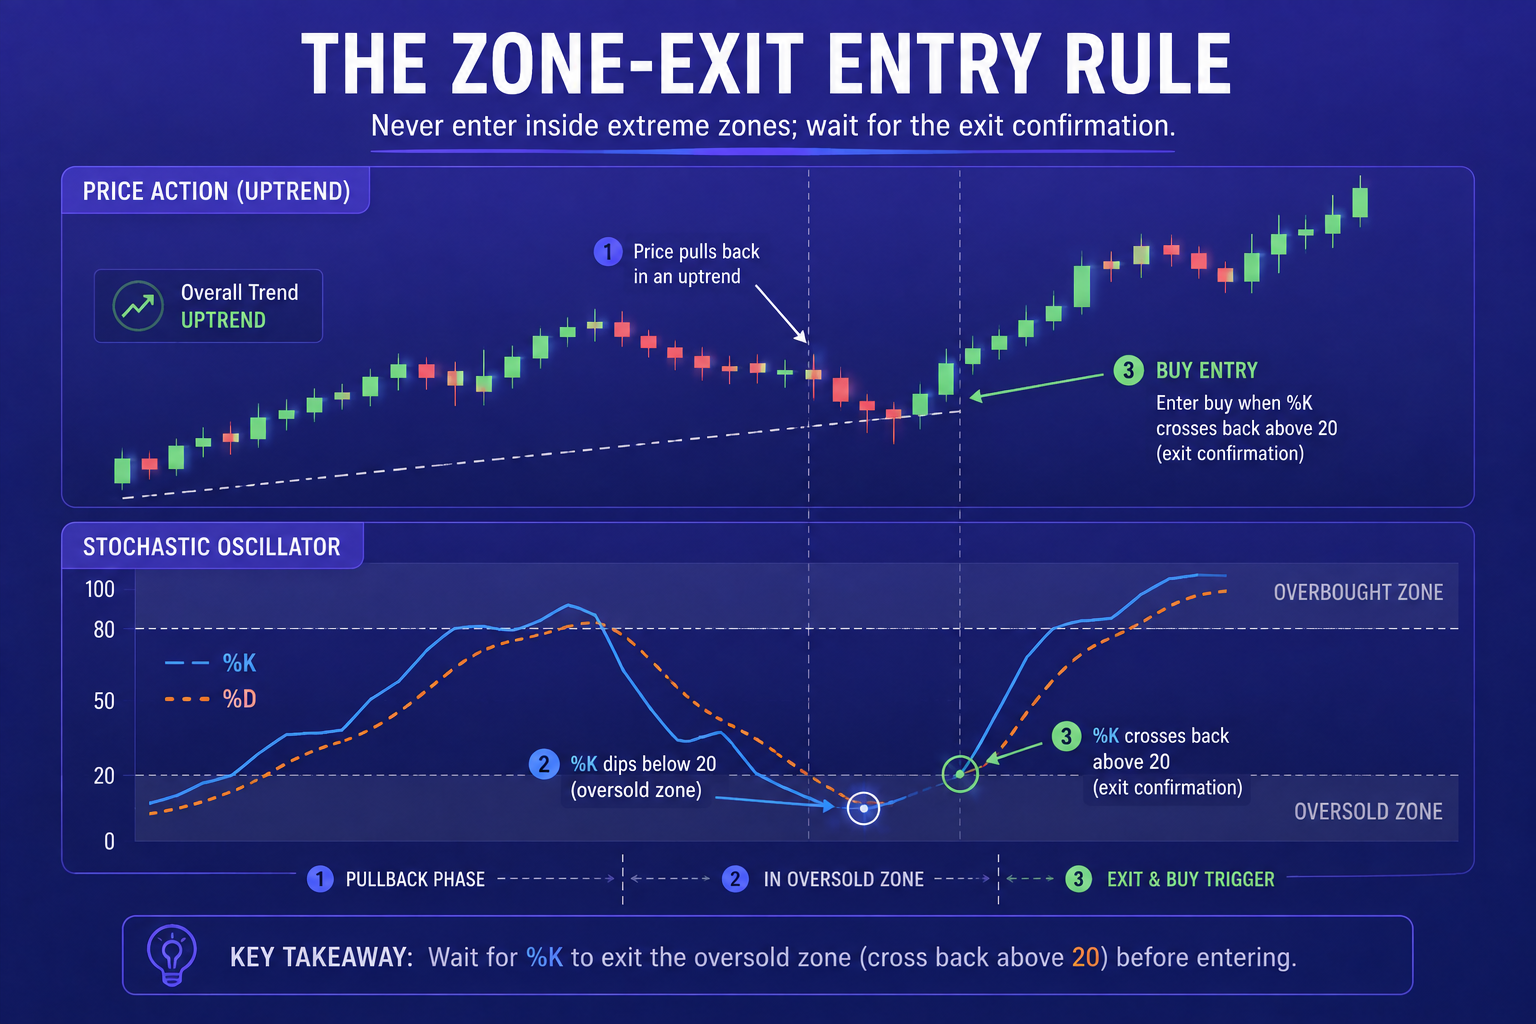
The Zone-Exit Rule solves this problem:
- For Long Entries: Wait for the Stochastic lines to drop below 20 into the oversold region. Do not buy yet. Wait for the %K line to cross above the %D line AND for both lines to clearly exit the oversold zone by crossing back above 20. The entry trigger occurs at the close of the candle that pushes the indicator back above 20.
- For Short Entries: Wait for the indicator to push above 80 into the overbought territory. Hold your trade until the %K line crosses below the %D line AND both lines cross back below 80. Your entry order triggers on the close of the candle confirming that exit.
This simple delay ensures that momentum has actually shifted back in your favor before you commit real capital. When I execute this strategy across user-friendly charting interfaces like IQ Option or Quotex, I wait for the candle to close to confirm that the oscillator has genuinely exited the threshold.
Rule 2: The Trend-Filter Crossover
No oscillator works well in isolation. If you trade every Stochastic crossover in a choppy market, you will get whipsawed repeatedly. I learned to pair the Stochastic Oscillator with a 200-period Exponential Moving Average (EMA) to establish baseline directional bias.
Here is how I structure this entry:
- Identify the Master Trend: Look at your higher timeframe chart or add a 200 EMA to your trading view. If price is trading above the 200 EMA, you are only looking for buy signals. If price is below the 200 EMA, you only take sell signals.
- Wait for a Pullback: In an uptrend (price above 200 EMA), wait for price to pull back toward a support zone or the moving average itself. As price pulls back, the Stochastic Oscillator will drop into oversold territory below 20.
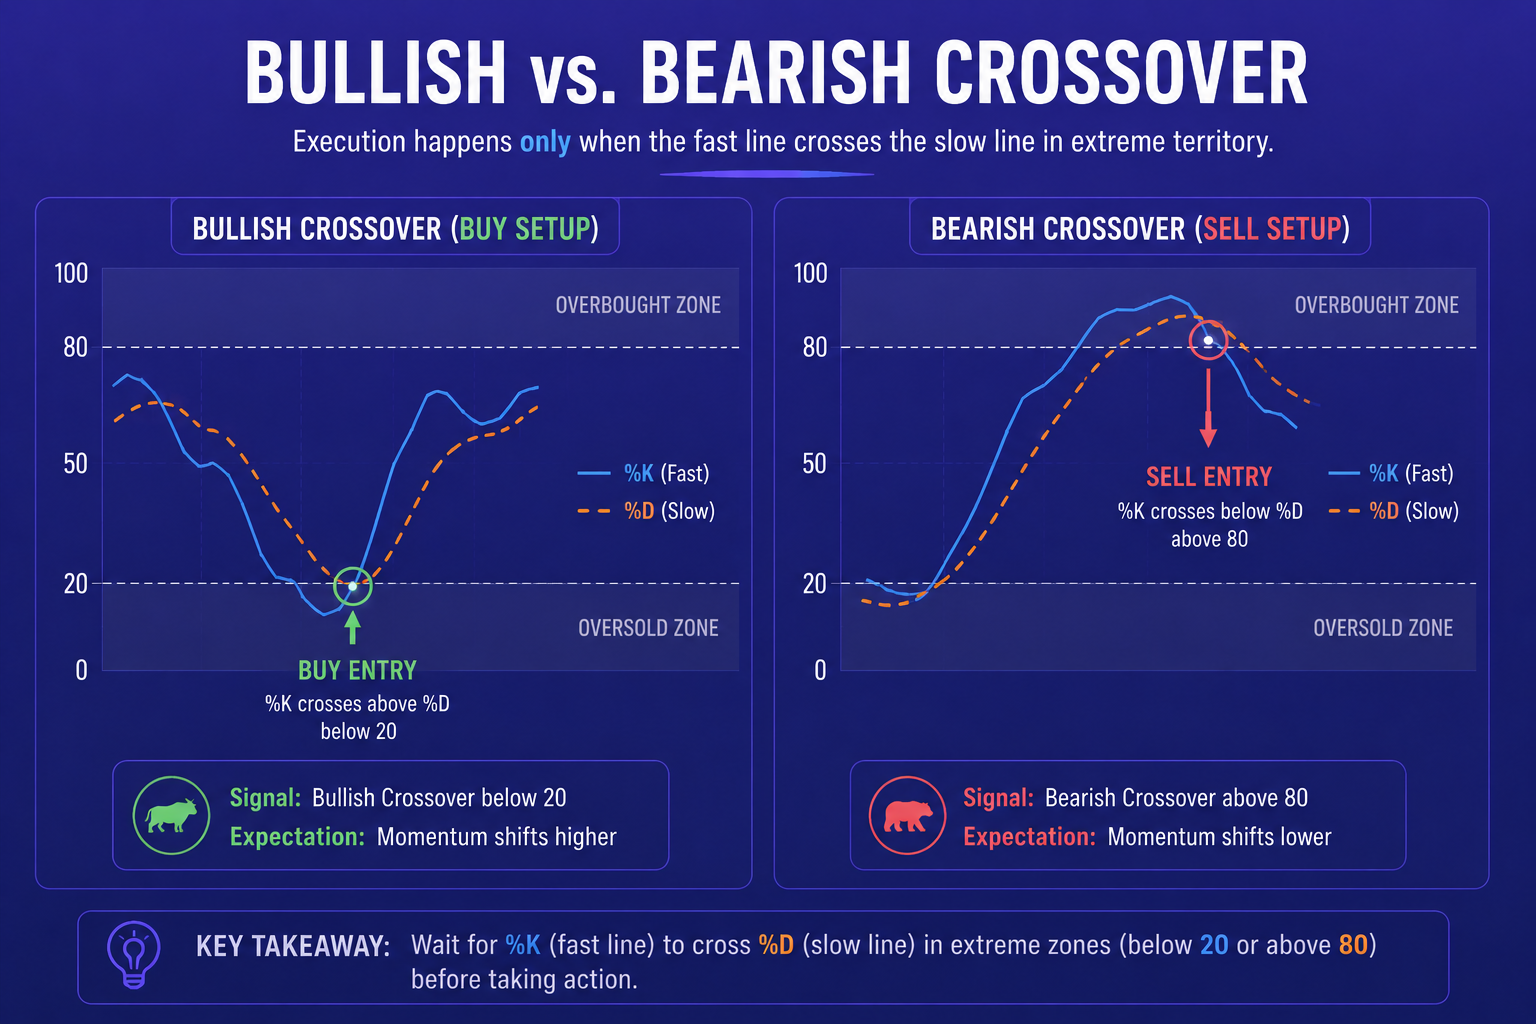
- Execute the Signal: When the %K line crosses above the %D line below 20 while price remains well above the 200 EMA, enter a long position at the market. Place your stop loss just below the recent swing low.
By filtering out counter-trend signals, your win rate improves dramatically. I routinely practice filtering momentum pullbacks across platforms like Pocket Option,Olymp Trade, and Deriv to sharpen my entry timing during high-volatility sessions.
Rule 3: Divergence Patterns for Trend Reversals
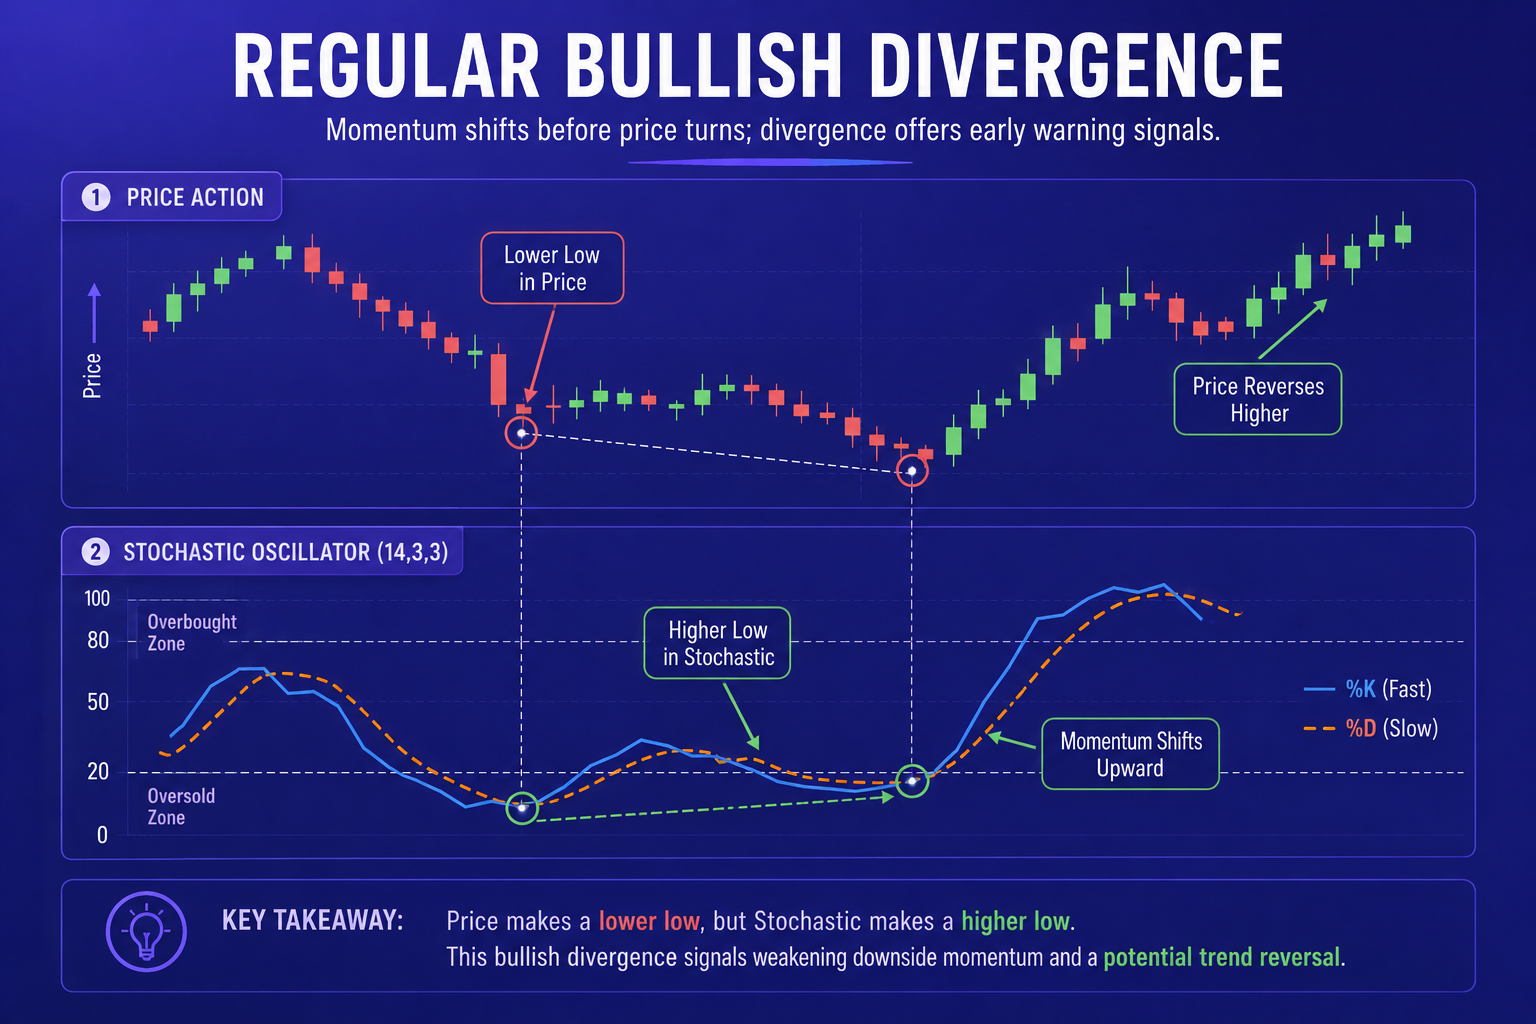
Divergence is perhaps the most powerful edge the Stochastic Oscillator provides. It occurs when price action and indicator momentum disagree, revealing hidden weakness in the prevailing trend.
- Regular Bullish Divergence: Price prints a Lower Low on the chart, but the Stochastic Oscillator prints a Higher Low in oversold territory. This signals that despite the lower price print, selling pressure is exhausting. Enter long when the %K line crosses above the %D line following the higher low on the indicator.
- Regular Bearish Divergence: Price prints a Higher High, but the Stochastic Oscillator forms a Lower High in overbought territory. Buyers are running out of steam. Enter short when %K crosses below %D following the indicator's lower high.
When I spot a clear divergence setup on multi-asset platforms like ExpertOption or CapitalCore, I always seek secondary confirmation from candlestick patterns like an engulfing candle or pin bar before entering the order.
Common Traps and How to Avoid False Signals
Mastering entry rules is only half the battle; avoiding false signals is what protects your trading account over the long haul. Early in my trading, I lost money because I treated every indicator line cross as an absolute command.
Here are the three rules I enforce to eliminate thin analysis and stay safe:
- Avoid Choppy Ranges: During tight consolidation or low-volume market sessions, the Stochastic lines will weave back and forth rapidly between 40 and 60. Taking trades in this zone is equivalent to flipping a coin. Keep your hands off the keyboard until lines reach extreme levels.
- Respect Multi-Timeframe Alignment: If you are trading the 15-minute chart, always check the 1-hour or 4-hour trend first. Taking a bullish Stochastic entry on a 5-minute chart while the 4-hour chart is in a heavy downtrend usually ends in failure.
- Never Trade During High-Impact News: Economic data releases can cause sudden price spikes that invalidate technical setups in seconds. Clear your positions or step aside when major interest rate decisions or employment data are released.
To deepen your understanding of structural technical analysis and chart pattern validation, explore more strategies on the official Becoin Trading Blog.
Final Thoughts: Gain Your Professional Trading Edge
The Stochastic Oscillator is not a complete trading system on its own, but when combined with clear entry rules, proper risk management, and trend filters, it becomes a sharp instrument for timing entries. Success in trading comes down to executing a repeatable edge with discipline, trade after trade.
If you are ready to take your technical analysis beyond basic indicators and gain actionable market intelligence, join us at Becoin Premium. You will unlock institutional-grade market forecasts, live entry alerts, and comprehensive technical breakdowns directly from experienced analysts through our dedicated Becoin Forecast Hub. Stop guessing where price is heading and start trading with clarity today.
Stochastic Indicator Explained for Beginners
This video provides a practical walk-through of the Stochastic Oscillator mechanics and shows how beginners can construct a structured trading strategy around overbought and oversold signals.
Risk Management for Small Accounts ($10–$50)
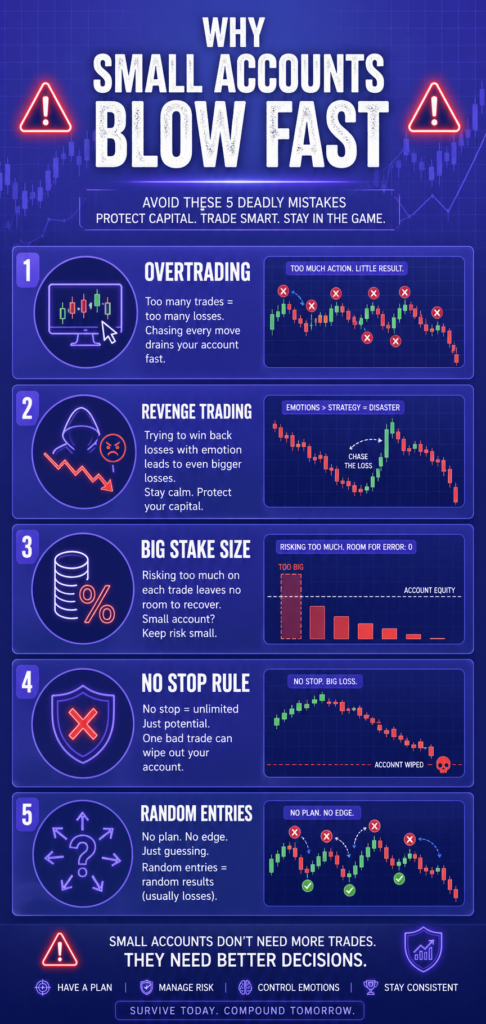
Starting with a small trading account can feel frustrating. You want fast growth, but one bad decision can wipe out weeks of progress. That is why risk management matters more for a $10 account than for a $1,000 account. Many beginners focus only on strategy. They search for the best indicators, signals, or entry methods. […]

The Clock and the Candle: How I Stopped Guessing the Best Time to Trade Day Trading
I still remember the night I blew my third trading account. It was 11:30 PM. The house was completely quiet, the market charts on my screen were barely crawling, and I was forcing trades out of pure impatience. I kept staring at a flatline asset, placing one-minute positions, convinced that the market owed me a […]

The Day I Lost My First Ten Dollars: My Hunt for the Best Mobile Trading App for Beginners
I still remember the exact shape of the cloud outside my window when my first live trade ended in the red. It was a crisp morning, and I was sitting on my couch with a lukewarm cup of coffee, staring at a flashing line on my smartphone screen. I had just deposited ten bucks, convinced […]
Best Broker for One Trade a Day Strategy in 2026
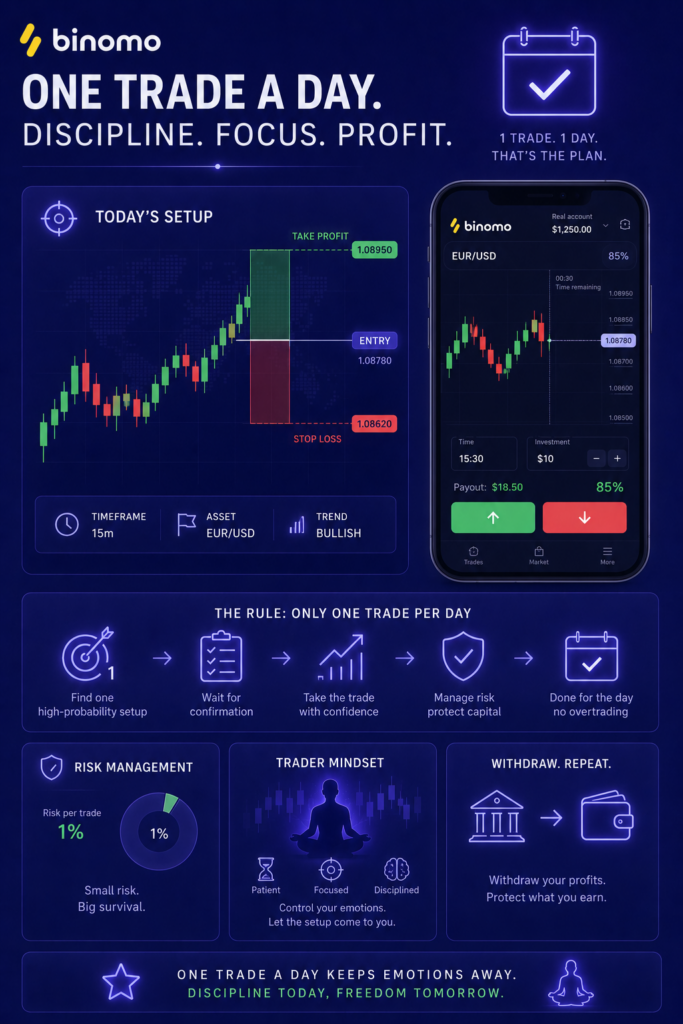
Most traders lose money because they trade too much. They enter random setups, chase candles, overreact emotionally, and turn a simple strategy into pure gambling. That is exactly why the one trade a day strategy is becoming more popular among smart traders in 2026. Instead of sitting in front of charts all day, this approach […]

Binomo Verification (KYC) for First Withdrawal: Exact Documents That Usually Trigger Rejection
The first time I tried to withdraw from Binomo, I was not worried about the trade. I was worried about the paperwork. That probably sounds strange if you are new. Most traders obsess over entries, expiry times, payout percentages, and strategy screenshots. I did too. But the moment I clicked my first withdrawal request, the […]
Capital Core Verification Process Explained: KYC, Restrictions, and Withdrawal Delays
I learned something the hard way with offshore-style brokers: the smoothest part is usually opening the account, funding it, and placing the first few trades. The real test starts when you try to move money back out. That’s exactly why I wanted to document the Capital Core verification process from a trader’s perspective, not from […]