Snowflake Forecast: SNOW Guards $228 as $244 Caps Every Rally
A data platform priced for perfection, trading like a range
Snowflake has become one of the more interesting stocks in enterprise software because the fundamental story and the price action keep disagreeing. Product revenue growth has stayed strong, net revenue retention has stabilised, and the company has attached itself credibly to the AI workload story through partnerships and its own model hosting layer. Yet the stock has spent months trapped between the same two prices.
That disagreement is usually a valuation argument playing out in public. Bulls are underwriting the growth rate. Bears are underwriting the multiple. Neither is obviously wrong, which is exactly why the range persists.
What the Snowflake forecast comes down to
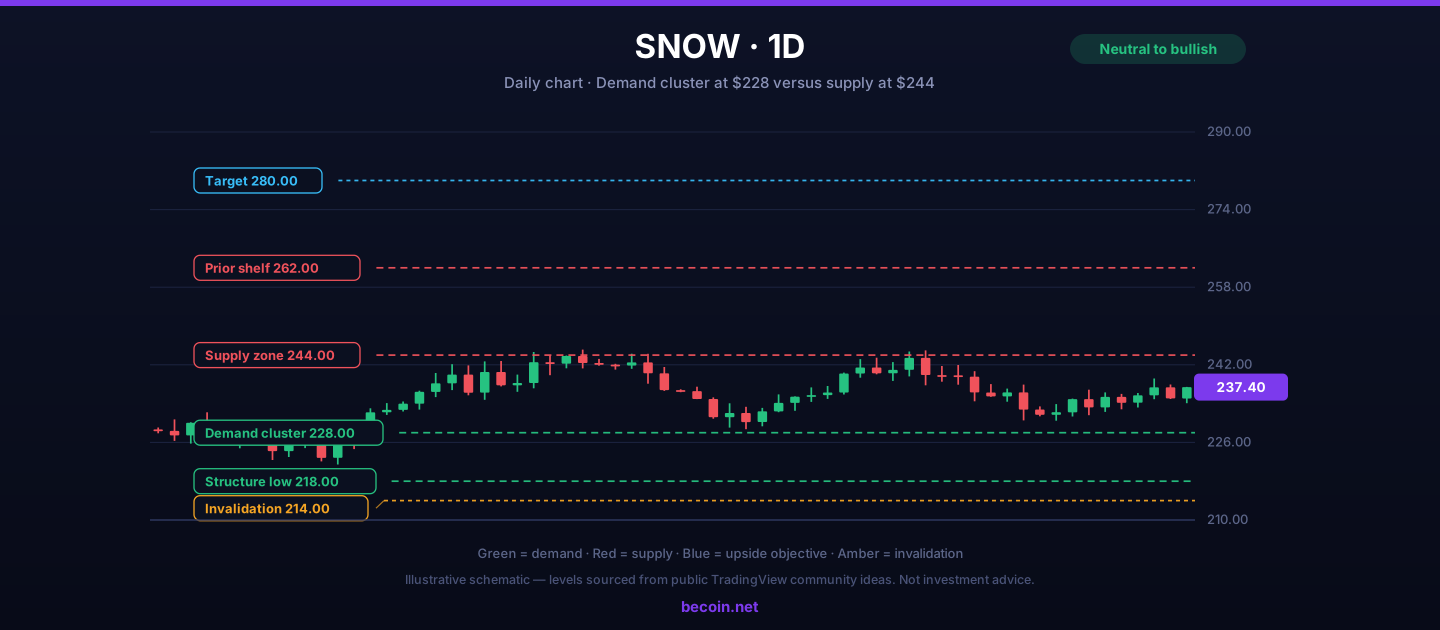
The chart resolves to four numbers:
- $228 to $232 is the demand cluster. Buyers have stepped in there on every pullback of this leg, and it lines up with the shorter-term moving averages.
- $218 is the structural low beneath that. Losing it changes the character of the chart from consolidation to distribution.
- $240 to $244 is the supply zone. Every rally has stalled inside it, which makes a weekly close above the band genuinely significant.
- $262 and $280 are the objectives above the range, the latter sitting close to the median of published analyst targets.
The bullish path
The high-quality entry is a pullback into $229 to $233 with a stop beneath $224. That risks roughly seven dollars to target the top of the range, and it lets a trader participate without paying up into supply.
The larger trade requires a catalyst. Earnings are the obvious one. A print that shows product revenue reaccelerating and consumption trends improving would give buyers the excuse they need to clear $244, and the air pocket between there and $262 is thin enough that the move could happen in a couple of sessions.
Why chasing the break is risky
Software stocks gap on earnings, and a gap through resistance is not the same as a breakout. Waiting for the first pullback after a gap, and requiring that pullback to hold above the old $244 ceiling, filters out most of the failed continuations.
The bearish path
A weekly close beneath $218 would put the $200 handle in play and would likely coincide with multiple compression across the entire high-growth software complex rather than anything company-specific. Below that, the next meaningful reference is a long way down, which is the risk in owning a name that trades on a rich multiple.
The valuation bears have a real argument. If growth decelerates even modestly while the multiple stays where it is, the stock has a long way to fall before it finds fundamental support. That is not a prediction, but it is the scenario a stop beneath $214 is designed to protect against.
What to watch besides the chart
Three things drive this stock: product revenue growth rate, consumption trends from existing customers, and the broader appetite for high-multiple software. The third is often the largest single driver in any given month, which is why Snowflake tends to move with its peer group rather than independently of it.
Traders who want equity-level projections tracked alongside these technical levels can follow the Becoin.net Premium Forecast for updated stock outlooks, and compare what each access level includes on the Becoin.net Tariff Plans page.
Position management around earnings
Holding a full position through an earnings print in a stock that regularly moves double digits is a coin flip, not a strategy. A more defensible approach is to reduce to a starter position before the event and add back into confirmed strength or weakness afterwards. The give-up in upside is real, but so is the reduction in variance.
For anyone already long from the demand cluster, trimming into $242 and leaving a runner for the breakout keeps the position honest without abandoning the thesis.
The bottom line
Snowflake is a range with well-defined edges. Above $244 on a weekly close it becomes a trend with $262 and $280 in view. Beneath $218 it becomes a broken structure with limited support. Until then, the edges are the trade and the middle is noise.
This analysis is educational and does not constitute investment advice. Equity trading carries substantial risk of loss.

Why Traders Move from Binomo to Deriv in 2026: The Real Reasons Behind the Switch
If you spend enough time around trading communities, you’ll notice a pattern. Many traders start with Binomo. Then, after a few months, a surprising number begin looking at Deriv. Some switch completely. Others keep both accounts but gradually move most of their trading activity to Deriv. I noticed this trend while talking to beginner traders […]

WTI reaches $89.43 as Brent clears $95 on renewed supply risk
WTI traded near $89.43 while Brent moved above $95 as Middle East shipping risk lifted crude for a fifth session. Key levels, catalysts and invalidation.

Bitcoin slips to $65,741 as oil and yields test the breakout
Bitcoin is near $65,741 as rising oil and Treasury yields test the $65.7K breakout floor. Here are the levels that confirm or invalidate the move.

The Day I Stopped Trading and Finally Started Making Money
It was a rainy Tuesday morning, and I was staring at my screen with a familiar knot in my stomach. The previous three days had been a slow, agonizing slide into the red. I had given back two weeks of hard-earned profits in less than seventy-two hours. Every asset I clicked on looked like a […]

Finding My Perfect Workspace: The Search for the Best Broker for My Daily Trading Routine
The alarm goes off at 6:00 AM. By 6:30 AM, I am sitting in front of my monitors with a steaming mug of black coffee. The house is completely quiet, the market is preparing its next major move, and my charts are completely bare. This is my daily sanctuary. For a long time, this morning […]

Which Broker Is Better for Weekend Trading?
It was a chilly Saturday morning, and while the rest of the world was sleeping in or catching up on shows, I was staring at a completely frozen screen. My usual EUR/USD chart looked like a heart monitor flatlining. The traditional markets were closed. The banks were shut down. For a long time, that was […]