Shiba Inu Defends Support as Sellers Lose Their Grip
Where the token stands
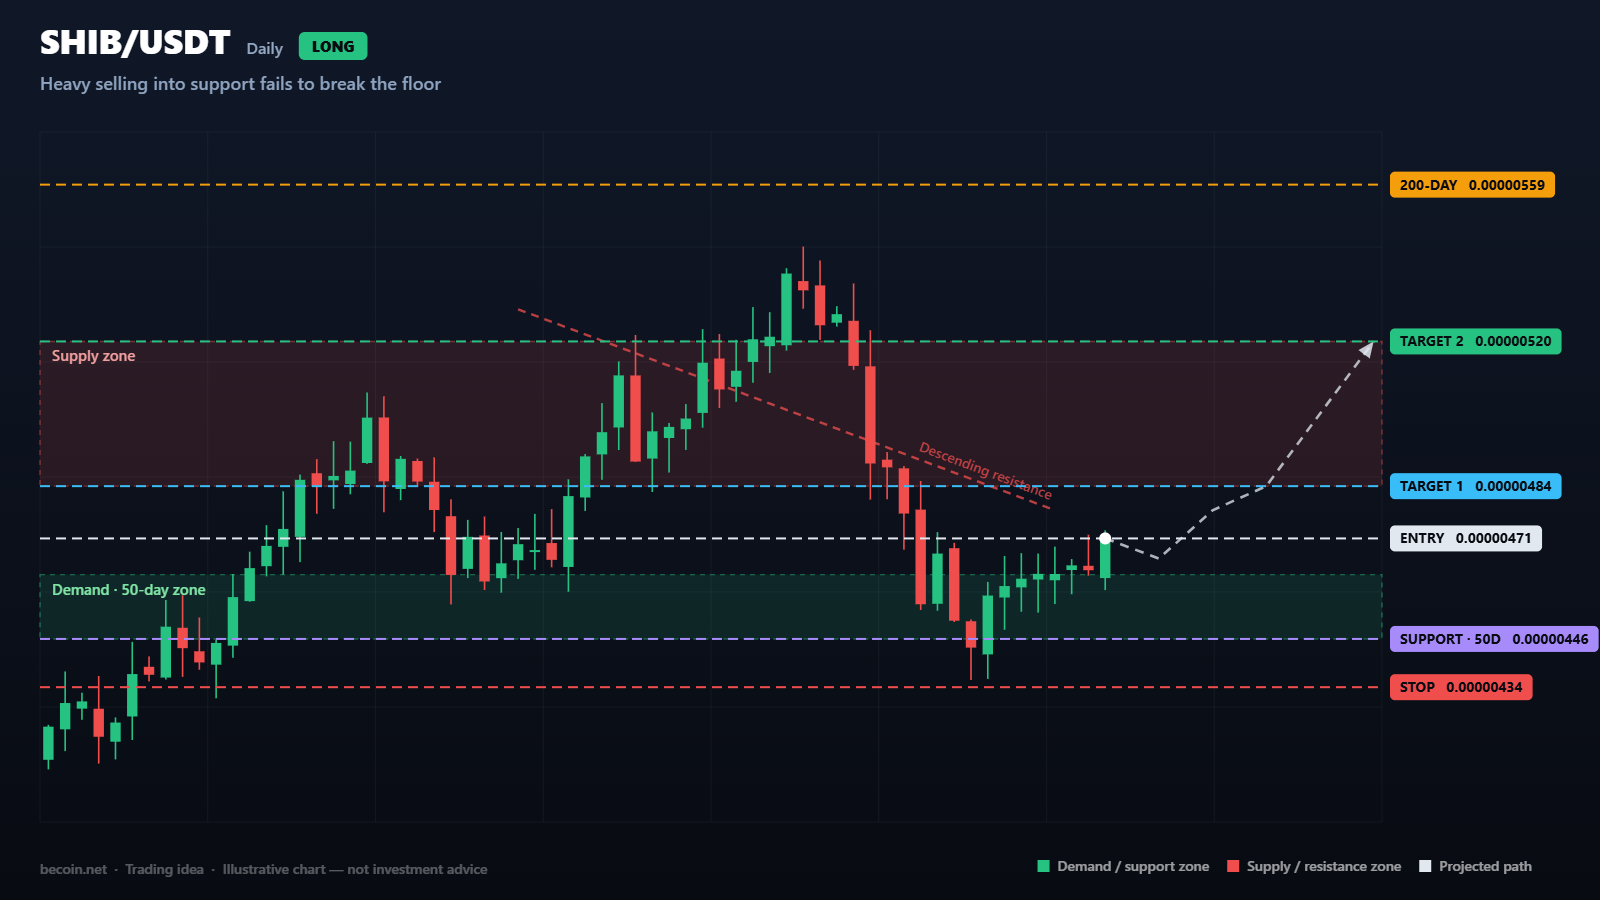
Shiba Inu is trading around 0.00000471 after a long grind down from the 0.00001484 high set earlier in the cycle. The token has spent recent weeks pressing against the 0.00000446 area, which is where the 50-day average now sits, and it keeps refusing to break. The 200-day average remains well above the market at roughly 0.00000559, so the dominant trend is still lower.
Momentum has flattened out near the midpoint, with the daily RSI around 52. In a downtrend, a neutral momentum reading close to support is the first thing that has to happen before anything better can develop. It is not a buy signal on its own, but it is a change in character worth noting.
What the chart is showing
The interesting detail is not the price itself but the behaviour around it. Several sessions have produced heavy selling volume into the 0.00000446 to 0.00000462 band without a corresponding drop in price. When supply arrives and price does not fall, someone is absorbing it. That is the difference between a level that is merely being tested and one that is being defended.
Above the market, a falling line drawn across the recent highs comes in near 0.00000478. Price has crept up to the underside of it, and the compression between that line and horizontal support is getting tighter with each session. Compression like this rarely lasts. It usually resolves with a fast move in one direction.
Levels that matter
Support is 0.00000446, backed by 0.00000434 as the point where the argument fails. The 52-week low at 0.00000405 is the deeper reference if that gives way.
Resistance stacks in three steps: 0.00000484 first, then 0.00000520, then the 200-day average at 0.00000559. That last one is the level that would genuinely change the trend rather than merely interrupt it.
How the idea could play out
The constructive path is a break above the falling line, a retest that holds, and a run at 0.00000484. Clearing that opens 0.00000520. Working from current levels with protection under 0.00000434, the first target offers a little over three times the risk and the second closer to thirteen times, which is the kind of asymmetry that makes a bottom-fishing attempt defensible even with a low hit rate.
The realistic expectation is that most attempts like this fail. The reason to take the trade is not confidence in the outcome, it is the size of the payoff when it works relative to the small, clearly defined cost when it does not.
What would invalidate it
A daily close below 0.00000434 removes the setup. At that point the demand that has been absorbing supply has stepped away, and the path toward the 0.00000405 low opens up. There is no need to argue with the chart at that stage.
Managing the position
Meme tokens move on attention rather than fundamentals, which means both the upside and the downside can arrive faster than in most markets. Position sizing matters more here than in almost any other setup, and it is sensible to assume the stop can be reached in a single candle. Taking half off at 0.00000484 and letting the balance run toward 0.00000520 with the stop at break-even is a reasonable way to handle a trade whose tail risk cuts both ways.
The bottom line
SHIB is not in an uptrend, and pretending otherwise would be a mistake. What it has is a support level that keeps holding under real selling pressure, a compressing range, and a clearly defined invalidation point a short distance below. That is enough to justify a small, well-controlled attempt, and not much more than that.
Becoin.net Premium Forecast - Becoin.net Tariff Plan
This analysis is a technical study prepared for educational purposes. It is not investment advice, and no outcome described here is guaranteed. Trade only with capital you can afford to lose.

Best Broker Without KYC (2026) — Truth + Risks Before You Choose
If you’re searching for the best broker without KYC, you likely want speed, low friction, and fast access to trading. But here’s the reality: Most traders don’t lose because of strategy.They lose because they choose the wrong platform early. No-KYC brokers can help you start quickly — but they also introduce hidden risks around withdrawals, […]

The Best Broker Without Complicated Features (And Why Simplicity Wins)
Most traders don’t fail because they lack knowledge. They fail because their platform buries them in noise before they even place their first trade. Here’s what actually works. It Started With a Confession From a $10 Trader A reader messaged us a few months back. He had been trying to trade for three weeks, had […]

WTI reaches $89.43 as Brent clears $95 on renewed supply risk
WTI traded near $89.43 while Brent moved above $95 as Middle East shipping risk lifted crude for a fifth session. Key levels, catalysts and invalidation.

Bitcoin slips to $65,741 as oil and yields test the breakout
Bitcoin is near $65,741 as rising oil and Treasury yields test the $65.7K breakout floor. Here are the levels that confirm or invalidate the move.

How Liquidity Affects Day Trading Results
When I first started trading day trading, I believed success was all about finding the perfect indicator. I spent weeks testing moving averages, RSI settings, support and resistance levels, and dozens of YouTube strategies that promised easy wins. Some worked for a few trades, but most failed. What confused me was that the same setup […]

Why Traders Move from Binomo to Deriv in 2026: The Real Reasons Behind the Switch
If you spend enough time around trading communities, you’ll notice a pattern. Many traders start with Binomo. Then, after a few months, a surprising number begin looking at Deriv. Some switch completely. Others keep both accounts but gradually move most of their trading activity to Deriv. I noticed this trend while talking to beginner traders […]