SAP jumps 10% to €141.20 as cloud backlog growth beats expectations
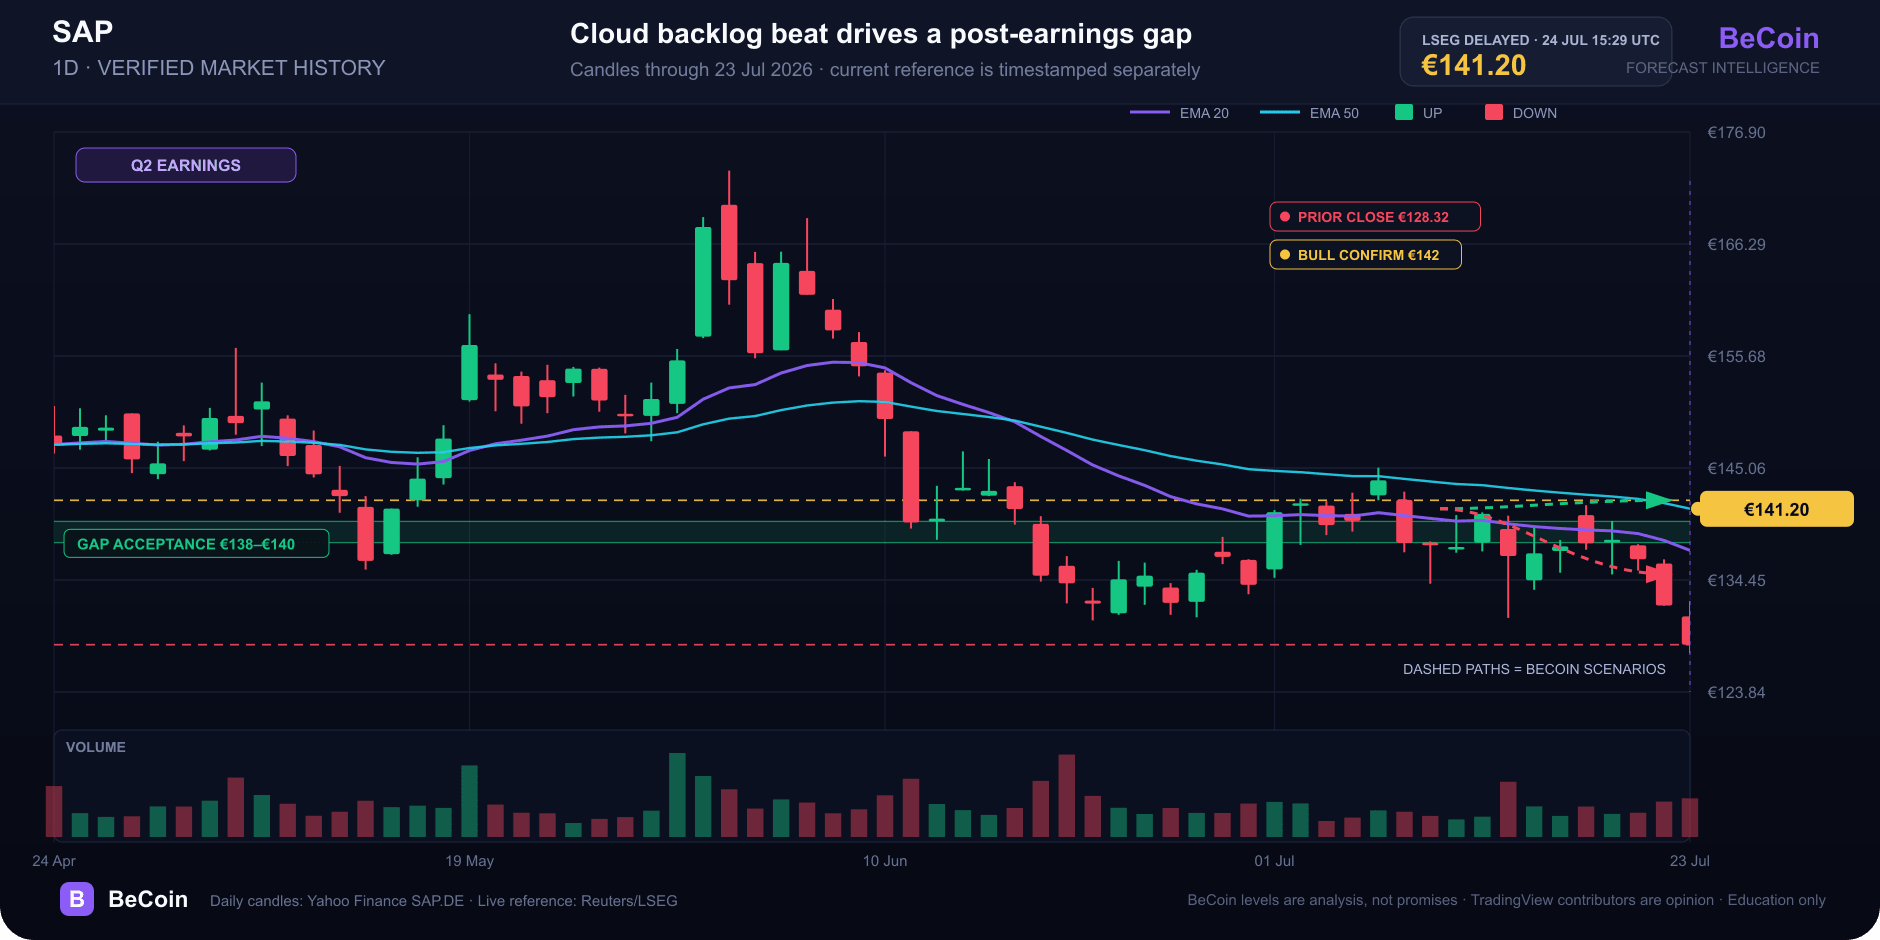
SAP traded at €141.20 at 15:29 UTC on July 24, up 10.04% in delayed LSEG data displayed by Reuters. The rally followed a second-quarter update in which current cloud backlog growth exceeded analyst expectations.
Why it matters
SAP’s official release reported €22.9 billion of current cloud backlog, up 27% as reported and 26% at constant currencies. Cloud revenue rose 22%, or 24% at constant currencies. Those figures show durable demand for the company’s migration from licensed software to recurring cloud products, even as investors continue to debate the cost and payoff of enterprise AI investment.
Google’s top results were dominated by the backlog beat and the share-price jump. The gap was a usable framework for separating the earnings surprise from the chart gap and from management’s longer-term execution risk.
Technical and market context
The prior close at €128.32 is the first major reference. Reuters showed a €130.88 open before the rally accelerated. Holding above €138–€140 would indicate that the earnings gap is being accepted; a retreat below €135 would signal that early buyers are taking profits. A full move back below €128.32 would invalidate the post-results breakout.
TradingView’s most recent SAP ideas were bullish before the release. One July 22 contributor proposed a breakout above $155.37 for the U.S. listing, while a July 20 thesis emphasized cloud backlog and valuation. Those are contributor opinions in a different listing and currency, not direct targets for Xetra shares.
BeCoin forecast read
BeCoin’s base case is consolidation above €138 after the sharp opening repricing. The bull case requires a close above €142 followed by continued acceptance rather than an intraday spike. The bear case begins below €135 and is confirmed only if the gap back toward €128.32 fills.
Follow SAP forecasts and compare risk scenarios with the Profit/Loss Calculator.
Methodology and sources
Price: Reuters/LSEG delayed SAPG.DE quote, 2026-07-24 15:29 UTC. Results: SAP Q2 and half-year 2026 release dated July 23. Market context: Reuters Europe report dated July 24. Google results were reviewed July 24; no People Also Ask module appeared for the exact query. TradingView SAP ideas are opinion only.
This content is for education only and is not financial advice.

Alphabet falls to $329.71 premarket as AI spending eclipses cloud growth
Alphabet traded near $329.71 premarket after strong Q2 revenue and cloud growth collided with a much larger AI spending plan. What investors need to watch.
TLT slips to $83.29 as oil pushes long-duration risk back into focus
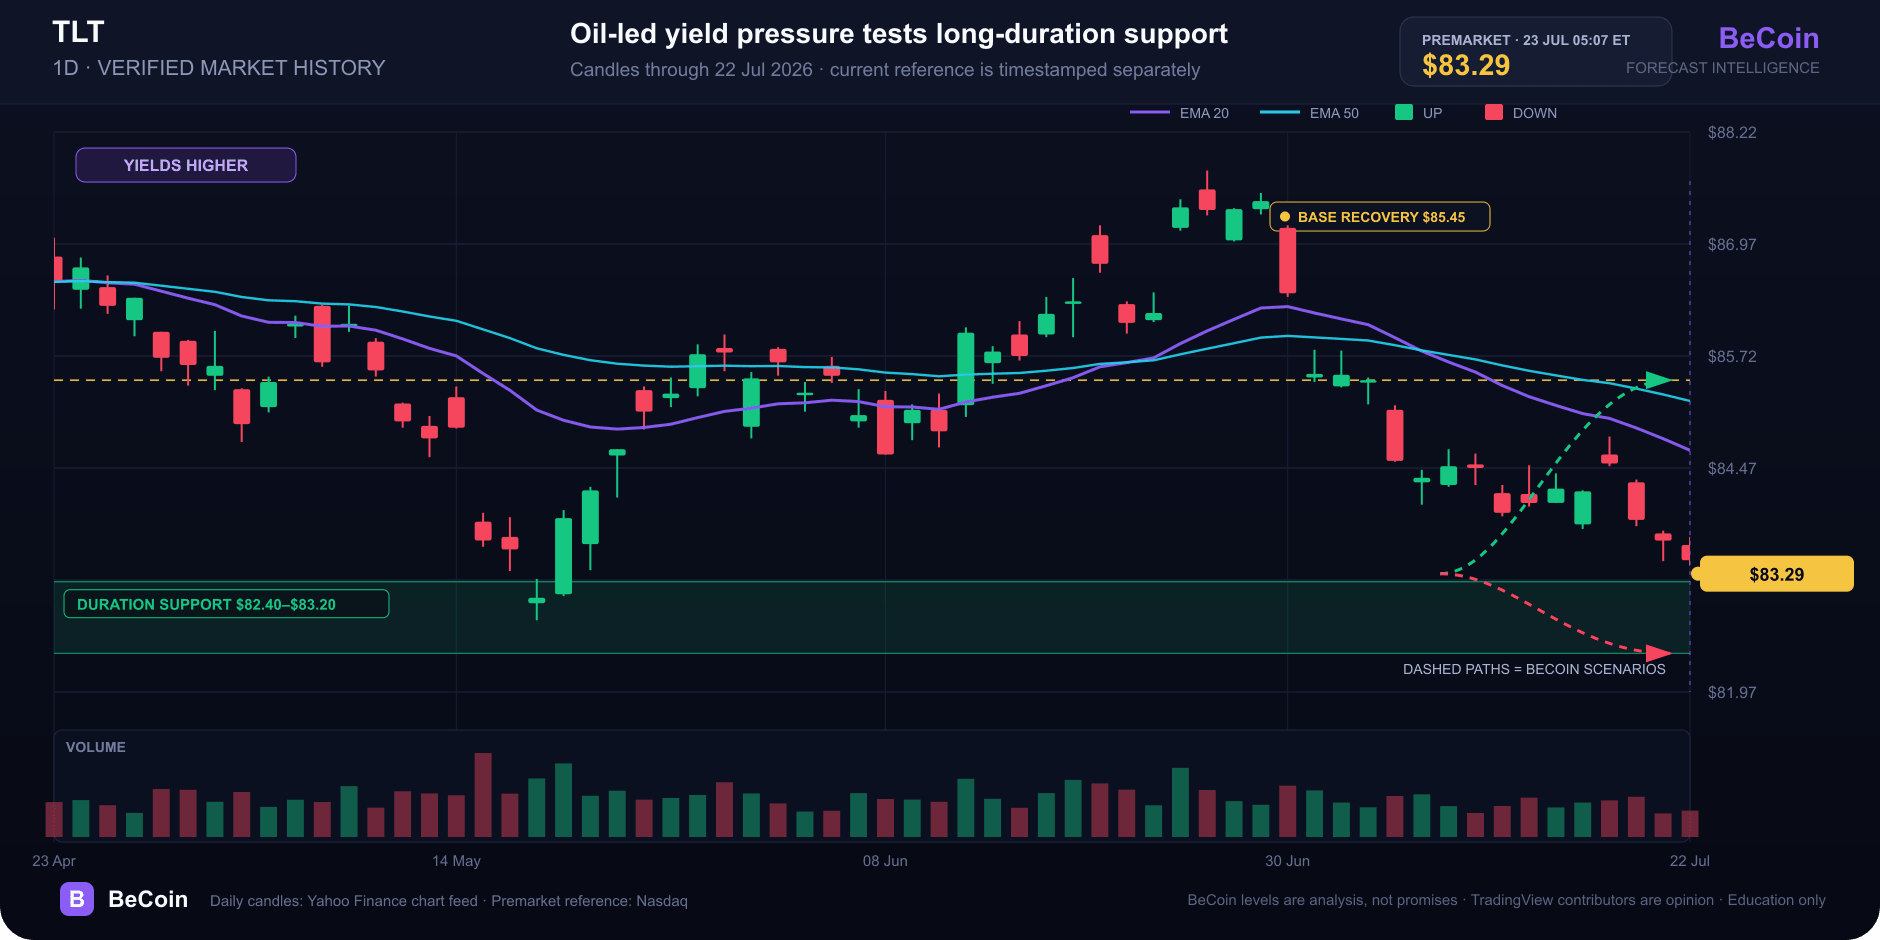
TLT traded near $83.29 premarket as oil and Treasury yields rose. Here is why duration matters and which levels separate a base from a breakdown.
Nasdaq 100 closes at 28,998 as Alphabet spending resets AI risk
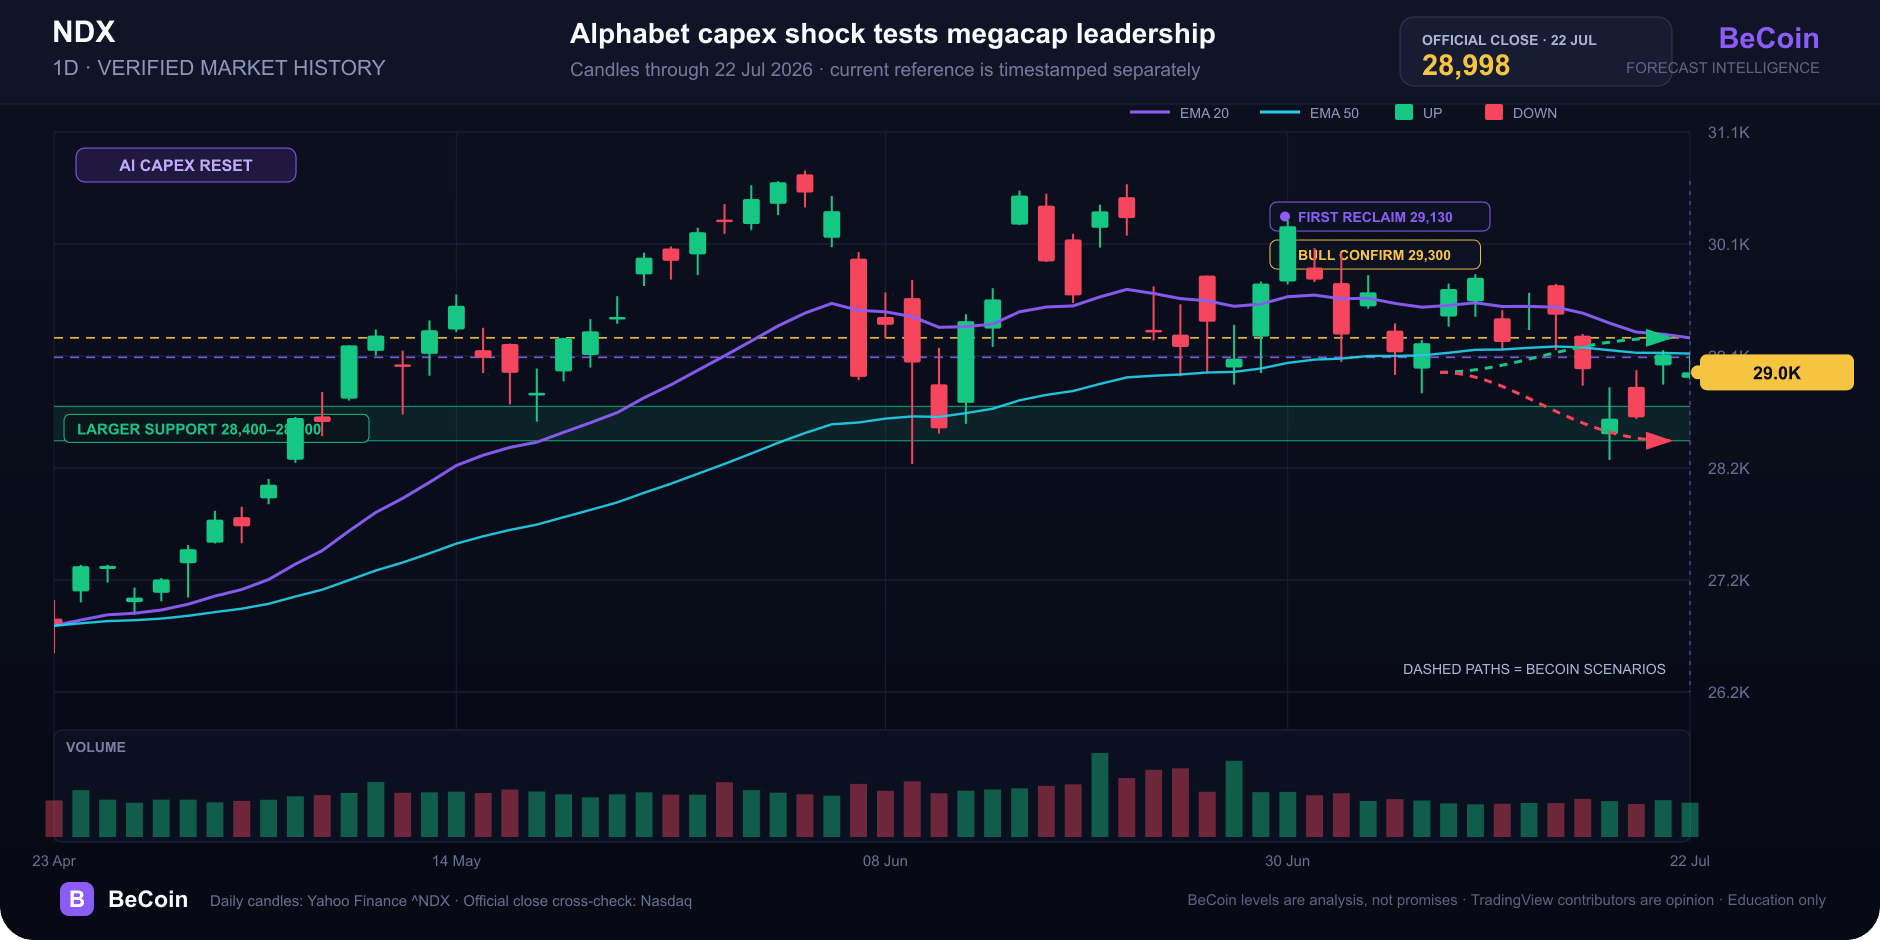
The Nasdaq 100 closed at 28,998.10 and futures slipped after Alphabet raised AI spending expectations. The 28,400–29,300 decision zone explained.

WTI reaches $89.43 as Brent clears $95 on renewed supply risk
WTI traded near $89.43 while Brent moved above $95 as Middle East shipping risk lifted crude for a fifth session. Key levels, catalysts and invalidation.

Deriv vs Binomo Deposit Methods: My 2026 Real Money Comparison Guide
I sat in the corner of a crowded coffee shop, my eyes fixed on my phone screen. After months of testing strategies on a demo account, I had finally saved up a small pocket of risk capital. I felt ready to trade live. A high-probability setup was forming on my charts, and my heart rate […]

Deriv vs IQ Option for Beginners in 2026: Which Platform Is Better to Start With?
Choosing your first trading platform can decide whether you stay consistent or quit after blowing your first account. Most beginners do not fail because trading is impossible. They fail because they start on platforms that confuse them, encourage emotional trading, or make risk management difficult. Two names that often appear in beginner discussions are Deriv […]