
Polkadot Forecast: DOT at 0.8682 Reclaims 0.85831
- DOT trades at 0.8682, down 0.39% on the day but back above all four moving averages on the 4-hour chart.
- March's halving cut annual issuance from 120 million to 55 million DOT, a structural change to the supply side that is still working through.
- 0.85831 is the level that decides the next move: the top of the reclaimed average cluster now acting as the floor.
Fundamental Analysis: Polkadot (DOT)
The supply picture changed materially in March, when the scheduled halving cut annual issuance from 120 million to 55 million DOT. Staking mechanics were then overhauled in July: validators now face a 10,000 DOT minimum self-stake, unbonding was compressed from 28 days to roughly 48 hours, and slashing risk for ordinary nominators was removed. Shorter unbonding cuts the liquidity penalty for staking, which tends to raise participation.
The governance and infrastructure side has moved in the same direction. OpenGov 2.0 handed the community full control over treasury allocation and protocol upgrades in August, removing council veto powers entirely, and a products devnet covering the Asset Hub, People and Bulletin chains launched on 31 August. Hyperbridge now enables near-instant transfers between parachains and Ethereum layer twos. The network's Nakamoto coefficient of 168 is well ahead of comparable chains, which matters for institutions underwriting consensus risk.
The balance is a chain with a genuinely improved supply and governance profile trading in a market that has concentrated its flows in the two largest assets. August's fund inflows exceeded $3 billion but went overwhelmingly to bitcoin and ether products. DOT's fundamentals have improved faster than its bid, which is why the reclaim of its moving averages matters more than usual.
Technical Analysis: Polkadot (DOT)
The 4-hour chart shows a rally from roughly 0.7300 on 19 August into the 1.0150 spike on 23 August, a three-session unwind, and then a shallow, rising base through late August that bottomed near 0.8150 on 31 August. Price at 0.8682 has since climbed back through the entire average stack, which now runs from 0.83913 up to 0.85831 beneath the market rather than above it.
Resistance is the 0.8930 shelf where the late-August rebounds stalled, then the round 0.9000 handle. Support is the 0.85664-0.85831 pair immediately beneath price, then 0.84826 and 0.83913 where the slower averages sit. A close below 0.83913 would invalidate the reclaim and put the 0.8150 low back in scope.
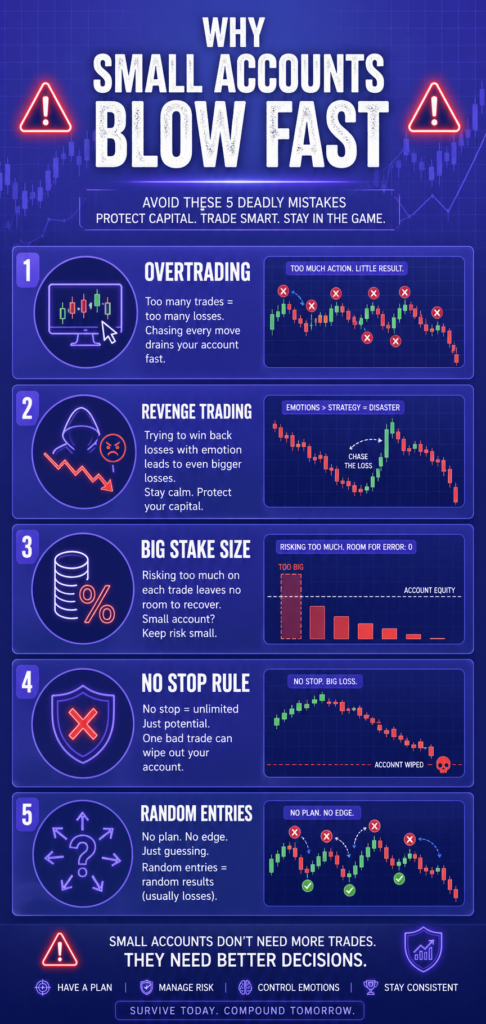
Risk Management for Small Accounts ($10–$50)
Starting with a small trading account can feel frustrating. You want fast growth, but one bad decision can wipe out weeks of progress. That is why risk management matters more for a $10 account than for a $1,000 account. Many beginners focus only on strategy. They search for the best indicators, signals, or entry methods. […]
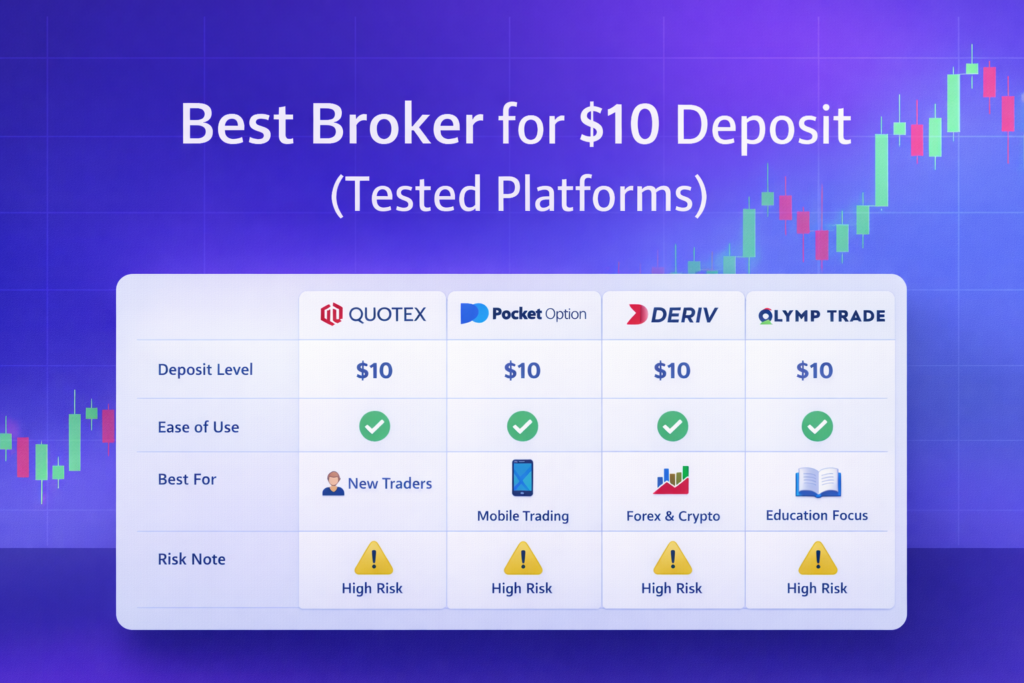
Best Broker for $10 Deposit (Tested Platforms – 2026)
If you are starting with a $10 deposit, choosing the wrong broker will cost you more than the market itself. Most platforms look similar, but execution speed, withdrawal behavior, and usability are very different in practice. This page is designed to help you make a fast, clear decision. No unnecessary details. Only tested platforms that […]

The Day I Stopped Trading and Finally Started Making Money
It was a rainy Tuesday morning, and I was staring at my screen with a familiar knot in my stomach. The previous three days had been a slow, agonizing slide into the red. I had given back two weeks of hard-earned profits in less than seventy-two hours. Every asset I clicked on looked like a […]

Finding My Perfect Workspace: The Search for the Best Broker for My Daily Trading Routine
The alarm goes off at 6:00 AM. By 6:30 AM, I am sitting in front of my monitors with a steaming mug of black coffee. The house is completely quiet, the market is preparing its next major move, and my charts are completely bare. This is my daily sanctuary. For a long time, this morning […]

Best Broker for Learning Price Action in 2026 (Tested by Real Traders)
Most traders think they need a better strategy. What they actually need is a better understanding of price. A few years ago, one of our community members had over ten indicators on his chart. RSI. MACD. Moving averages. Bollinger Bands. Stochastic. Every new YouTube video added another indicator. The result? More confusion. Not more profits. […]

Which Broker Has Faster Withdrawals? Real 2026 Comparison for Traders
When most beginners choose a broker, they focus on bonuses, signals, or flashy interfaces. But after trading for a while, you realize one thing matters more than almost anything else: How fast can you actually withdraw your money? A broker can look perfect until your first withdrawal request gets stuck in “processing” for three days. […]