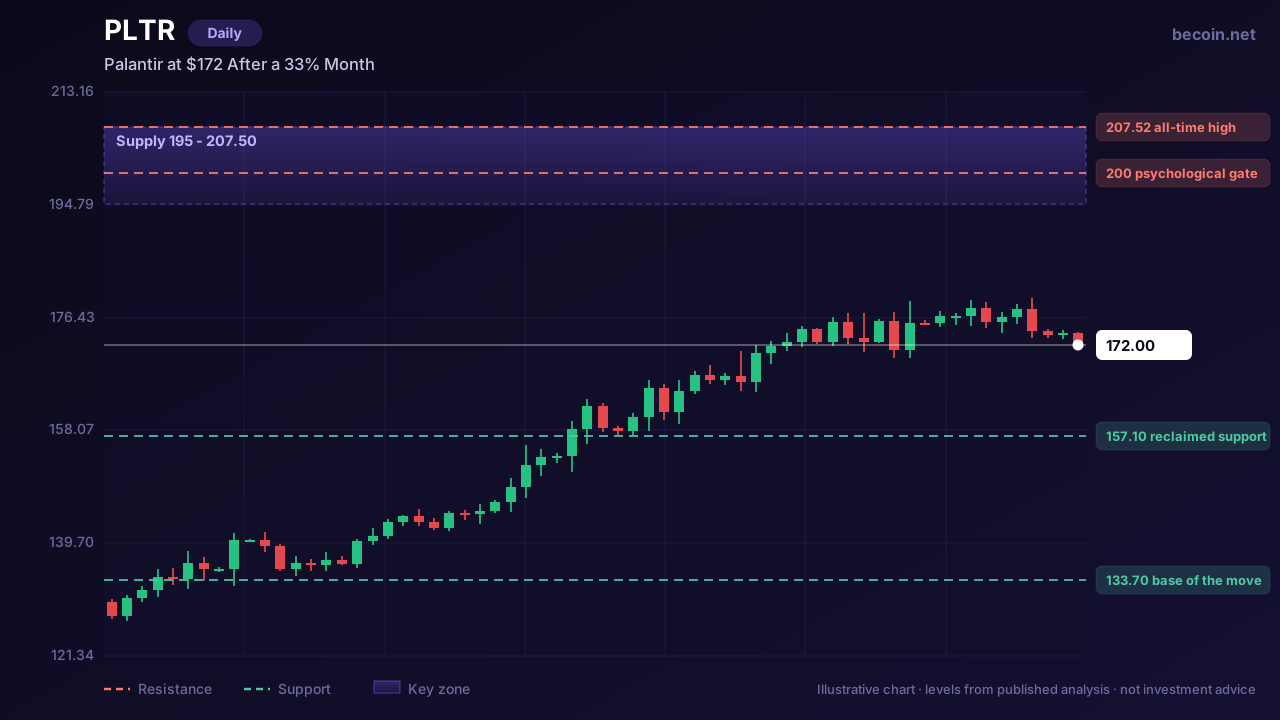
Palantir at $172 After a 33% Month — The $200 Retest Is Back on the Table
Palantir trades near $172, off about 3% on the day but up roughly 33% over the past month and 4.5% on the week. It is still slightly negative over a year, which tells you how much ground was lost before this recovery began. The all-time high of $207.52 now sits about 17% overhead.
The move that rebuilt the chart
The recovery followed a Q2 report that came in ahead of expectations, and the market's response was less about the numbers than about what they invalidated. Palantir had spent months trading like a stock whose story had peaked — a 35% drawdown from the November high, a long grind below its major moving averages, and a steady drift of sell-side scepticism about the multiple.
The move up cleared that. Price reclaimed the 200-day average around $157 and then kept going, which is the sequence that matters. A stock that reclaims long-term trend support and immediately extends is behaving differently from one that reclaims it and stalls.
What the breakout actually cleared
Several traders had been tracking an inverted head-and-shoulders structure through the base, with the head near $107 and a neckline in the mid-$130s. The measured objective from that pattern sat near $166. Price has now taken it out. That is worth noting for a specific reason: when a pattern target is achieved and price keeps going, the traders who sold into the target become a source of demand on any pullback rather than a source of supply. Our Becoin.net Premium Forecast tracks this name through each of those levels as the tape develops.
The reclaimed $157 level is the first real test of that. It was resistance on the way up, it is the 200-day average, and it is where a normal pullback in a healthy advance would find buyers. How price behaves there matters more than how it behaves at the highs.
The Palantir band between here and the record
Between $195 and roughly $207.50 sits the supply that ended the last advance. That is where holders from the November peak finally get back to break-even, and it is the single most predictable source of selling on the chart. Any approach to the record should be expected to meet it.
The $200 handle inside that band is a genuine psychological gate rather than just a round number, because it is close enough to the record to attract profit-taking and far enough above current price to require real buying to reach. Clearing it on a closing basis and holding is what would open the discussion about new highs.
The argument that never goes away
Palantir's valuation has been described as stretched at every price point on the way from $6 to $207, and it will be described that way at $250. That is not a reason to dismiss the concern — the multiple genuinely does leave very little room for a growth disappointment — but it is a reason to be careful about using it as a timing tool. Expensive stocks in strong uptrends stay expensive for a long time, and the people who were right about the valuation in 2023 lost a great deal of money being right.
The more useful version of the concern is this: a stock priced for near-perfect execution has an asymmetric reaction function. Good news moves it modestly; disappointing news moves it violently. That is a position-sizing problem, not a directional one.
Levels that keep you honest
Above, $200 then $207.52. Below, $157 is the line that decides whether this is a trend or a rally — a daily close beneath it would put the whole advance back under review, with the $133 base as the next real reference. At $172, the stock is in the middle of that, which is a fine place to hold a position and a poor place to start one.
Access levels for the daily level maps, scenario updates and alerts are set out on Becoin.net Tariff Plans.
This is market analysis for educational purposes and is not investment advice. Trading carries risk of loss.

How Understanding Market Structure Saved My Day Trading
I remember the exact moment my trading account hit zero for the third time in a single month. It was a rainy Tuesday evening, and I was staring at a 1-minute chart on my laptop screen. The price had been moving up aggressively. It looked like a flawless rocket ship to the moon. I clicked […]

Which Broker Has Better Risk Management Tools?
The burning smell of my own account blowing up is a scent I will never forget. It was a rainy Tuesday afternoon a few years back. I sat huddled over my laptop, watching a currency pair oscillate. Confident, arrogant, and entirely unprotected, I clicked buy. Minutes later, a sudden market spike completely wiped out my […]

Finding the Best Trading Broker for Side Income: My Raw, First-Hand Journey to Consistent Daily Wins
Six months ago, I sat at my kitchen table staring at an accumulation of household bills, realizing my primary salary was no longer cutting it. I didn’t want a second job that required clocking into a physical location or taking endless boss mandates after hours. I needed a flexible, scalable side income. That night, I […]

Best Broker for Learning Price Action in 2026 (Tested by Real Traders)
Most traders think they need a better strategy. What they actually need is a better understanding of price. A few years ago, one of our community members had over ten indicators on his chart. RSI. MACD. Moving averages. Bollinger Bands. Stochastic. Every new YouTube video added another indicator. The result? More confusion. Not more profits. […]

Which Broker Has the Cleanest Interface? Real Comparison for Beginners in 2026
Looking for the cleanest trading interface in 2026? Compare Binomo, IQ Option, Quotex, Deriv, and more based on speed, layout, usability, mobile experience, and beginner friendliness. When most beginners choose a broker, they focus on bonuses, payouts, or deposit methods. But after testing multiple platforms for months, I realized something surprising: A messy interface can […]

Which Broker Has Faster Withdrawals? Real 2026 Comparison for Traders
When most beginners choose a broker, they focus on bonuses, signals, or flashy interfaces. But after trading for a while, you realize one thing matters more than almost anything else: How fast can you actually withdraw your money? A broker can look perfect until your first withdrawal request gets stuck in “processing” for three days. […]