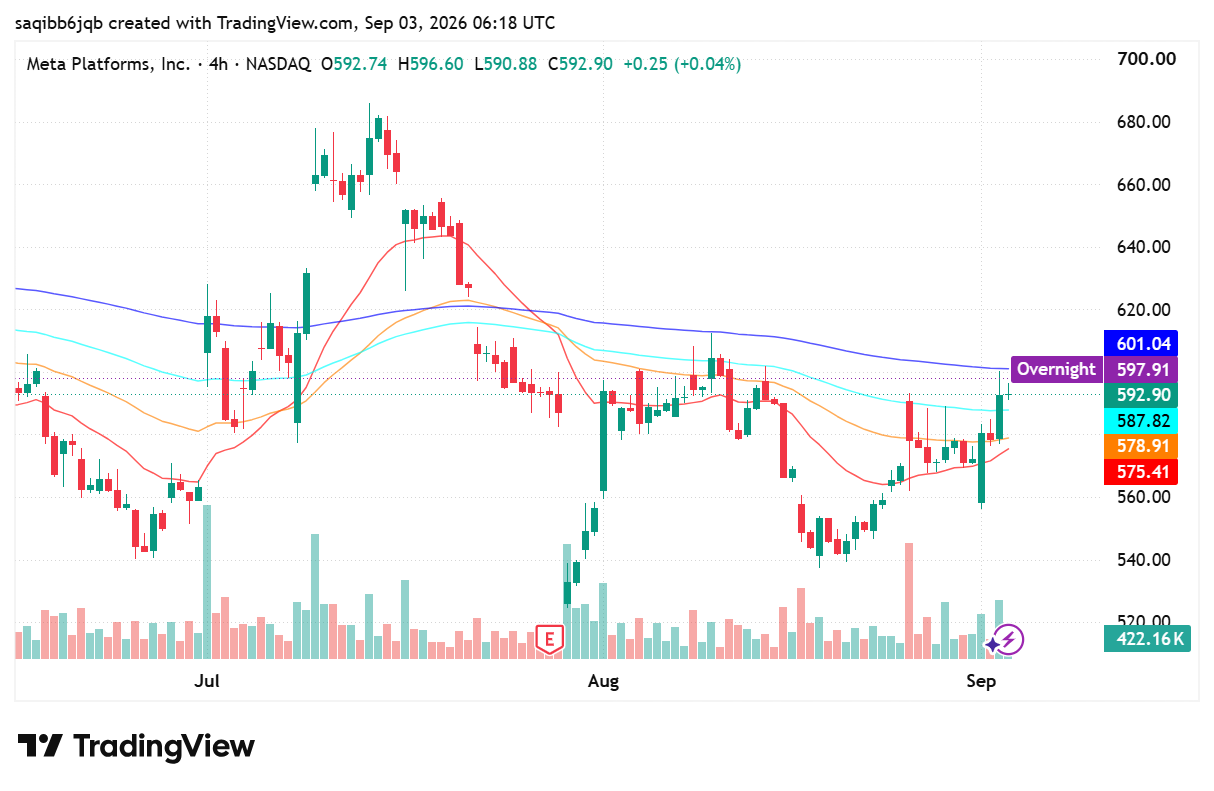
META Forecast: 592.85 Tests the 601.04 Average
- 592.85 on META, up 2.47% on the day, with the stock recovering the ground it lost after the July quarter report.
- Revenue grew 28% to $60.8 billion, but capital expenditure guidance of $130 to $145 billion is what the market is actually trading.
- The 601.04 average is the level that decides whether this becomes a recovery or another lower high.
Fundamental Analysis: Meta Platforms (META)
The advertising business is not the problem. Meta reported second-quarter revenue of $60.8 billion, up 28% year on year and ahead of the roughly $60.3 billion consensus, with growth of 27% on a constant currency basis. That is a mature business compounding at a rate most of the market would not have underwritten two years ago, and it came with no sign of the pricing softness that periodically worries the sell side about digital advertising.
The counterweight is what the company is spending to get there. Diluted earnings per share came in at $6.18, down 13% from $7.14 a year earlier and roughly 15% short of expectations, and full-year capital expenditure guidance was narrowed to $130 to $145 billion, lifting the floor by $5 billion. The stock fell 8% to 10% after hours on that combination. The concern is not the size of the spend on its own but the absence of a visible revenue line scaling alongside the infrastructure, of the sort that peers can point to in their cloud segments.
So the argument in this stock has become a timing question rather than a quality question. If the infrastructure investment produces a monetisable product line, current earnings compression is an accounting artefact of building it. If it does not, the market is paying for depreciation. Nothing between now and the next report resolves that, which is why the shares are trading on flow and positioning rather than on the numbers already reported.
Technical Analysis: Meta Platforms (META)
The 4-hour chart covers a full round trip. The stock peaked near 683 in July, sold off through the back half of the month, and gapped lower on the early August earnings release marked on the chart. The decline bottomed around 530 in mid-August, and the recovery since has been methodical rather than explosive: a base near 555 to 570 through late August, then a push into September that has carried price to 592.85. The stock now sits above the 575.41, 578.91 and 587.82 averages, with only the 601.04 average above it.
Resistance is 601.04 first, then the 620 shelf that acted as support on the way down in July. Support is the 578.91 average, then 560, with the August low near 530 the structural floor. A rejection at 601.04 that carries price back beneath 578.91 would turn this recovery into another lower high and invalidate the constructive read.

Trading Currency Strength Instead of Single Pairs
It was a Tuesday afternoon when I realized I was fighting a losing battle against a ghost. My screen was a chaotic web of indicators. I had the EUR/USD chart open, a moving average crossing over here, a relative strength index flashing oversold there, and a price action setup that looked textbook perfect. I clicked […]

Which Broker Has Better Risk Management Tools?
The burning smell of my own account blowing up is a scent I will never forget. It was a rainy Tuesday afternoon a few years back. I sat huddled over my laptop, watching a currency pair oscillate. Confident, arrogant, and entirely unprotected, I clicked buy. Minutes later, a sudden market spike completely wiped out my […]

The Best Broker Without Complicated Features (And Why Simplicity Wins)
Most traders don’t fail because they lack knowledge. They fail because their platform buries them in noise before they even place their first trade. Here’s what actually works. It Started With a Confession From a $10 Trader A reader messaged us a few months back. He had been trying to trade for three weeks, had […]

Which Broker Has the Cleanest Interface? Real Comparison for Beginners in 2026
Looking for the cleanest trading interface in 2026? Compare Binomo, IQ Option, Quotex, Deriv, and more based on speed, layout, usability, mobile experience, and beginner friendliness. When most beginners choose a broker, they focus on bonuses, payouts, or deposit methods. But after testing multiple platforms for months, I realized something surprising: A messy interface can […]

Which Broker Has Faster Withdrawals? Real 2026 Comparison for Traders
When most beginners choose a broker, they focus on bonuses, signals, or flashy interfaces. But after trading for a while, you realize one thing matters more than almost anything else: How fast can you actually withdraw your money? A broker can look perfect until your first withdrawal request gets stuck in “processing” for three days. […]

Best Trading Platform for Slow Internet in 2026
A slow internet connection can ruin trades faster than a bad strategy. Charts freeze, apps reload, and delayed execution creates unnecessary losses. This is especially common for traders using mobile data, shared WiFi, or older smartphones. Most broker reviews ignore this issue completely. After testing multiple platforms on weaker connections and low-end Android devices, some […]