
Identifying Your Most Profitable Trading Hours
Three years ago, my trading log looked like an emergency room triage report. I was executing thirty to forty trades a day across every asset class I could get my hands on. My screens were constantly lit up with dynamic charts, RSI oscillators, and order flow indicators. Yet, every week ended the exact same way: a slow, agonizing bleed of capital.
The most frustrating part was that my technical analysis wasn't the issue. My chart pattern setups were sound, my risk management rules were disciplined, and my win rate during specific sessions hovered around 72%. But by the time Friday evening arrived, I was consistently in the negative.
It took a painful $4,000 drawdown over a single month for me to realize that I wasn’t fighting the market makers, the algorithms, or bad luck. I was fighting time.
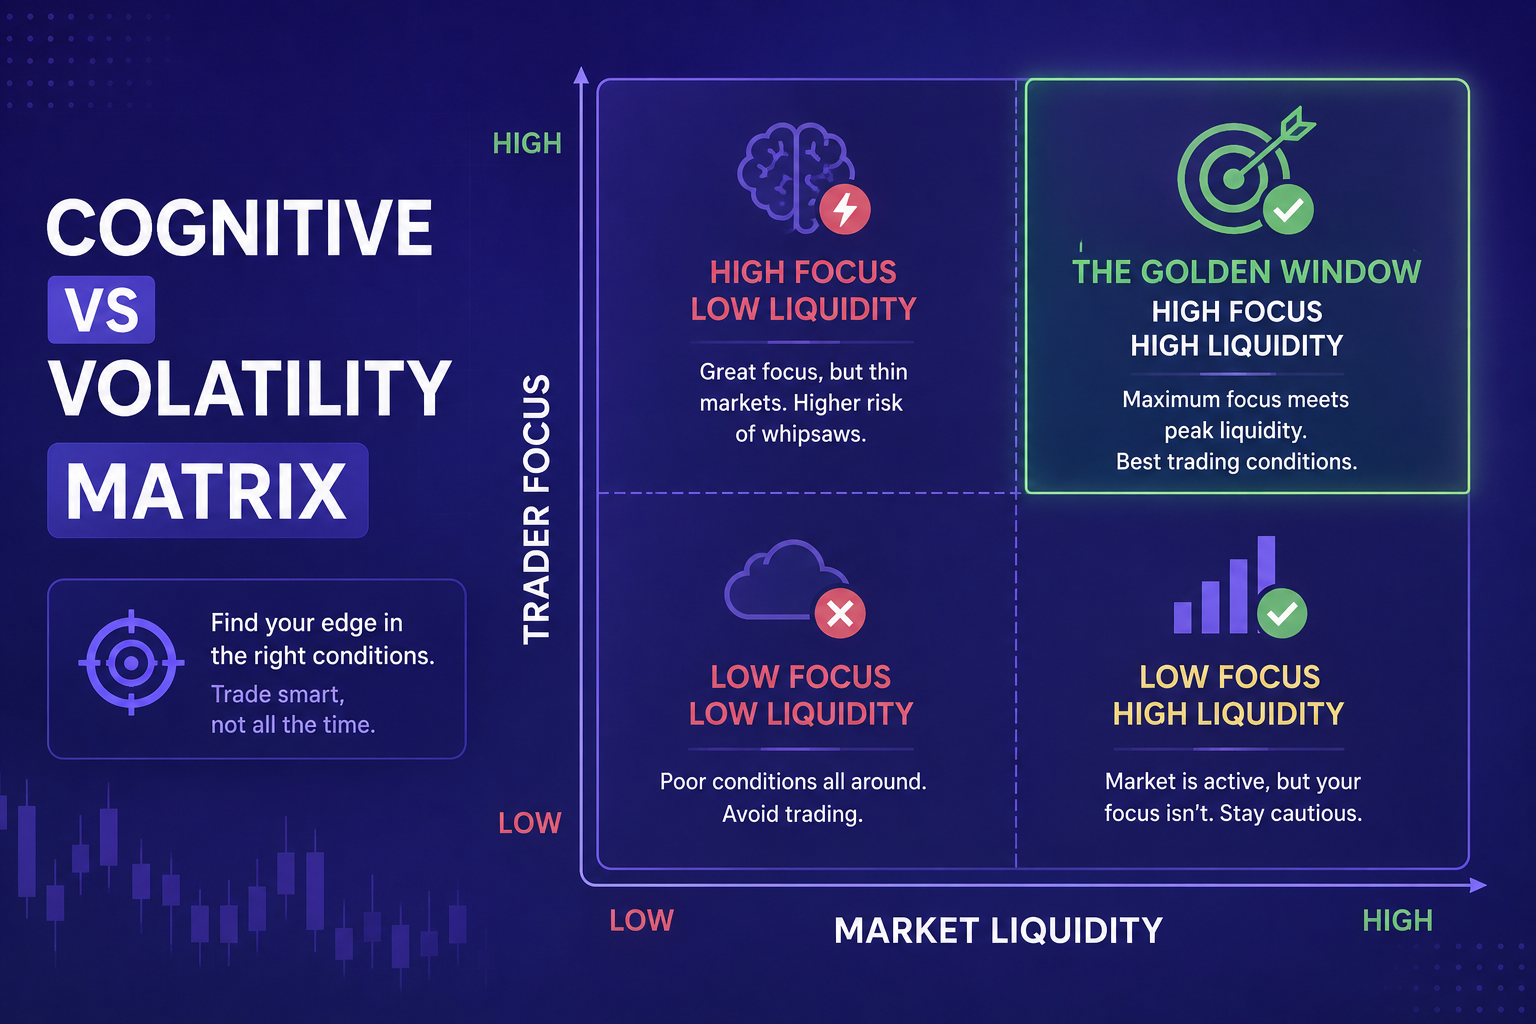
Understanding how market volatility interacts with your personal decision-making bandwidth changes everything. If you are struggling with inconsistent returns, the problem might not be your strategy at all. It might simply be when you are clicking the execution button.
The Hard Lesson: Volatility Without Liquidity Is Financial Suicide
During my early trading days, I assumed that a 24-hour market meant 24 hours of equal opportunity. I would jump onto platforms like IQ Option during late-night Asian sessions, forcing trades on EUR/USD while European and American institutions were completely offline.
What I failed to grasp back then was the vital distinction between high-liquidity volatility and low-volume noise.
When you trade during off-peak hours, low order book depth leads to unpredictable price spikes, erratic wick rejections, and wider bid-ask spreads. On platforms offering short-term options or contract trading, low liquidity often compresses payout percentages or creates random micro-slippages that turn winning setups into loss-making trades.
I began auditing my trading journal with a single focused metric: performance mapped directly against UTC time blocks. The results were startling.
- 00:00 – 07:00 UTC (Tokyo/Sydney dominance): My win rate was a miserable 34%. I was constantly getting chopped up in range-bound channels.
- 08:00 – 12:00 UTC (London Open): My win rate climbed to 61%. Real volume entered the market, and trend continuation setups held firm.
- 13:00 – 16:30 UTC (London & New York Overlap): My win rate peaked at 74%. Institutional liquidity hit maximum density, clean breakouts sustained momentum, and directional bias became remarkably clear.
- 17:00 – 22:00 UTC (Late US Session): My performance crashed back down to 41%.
I wasn't just losing money because of low market volume in the late evening; I was losing because my cognitive sharpness had completely degraded after staring at screens for twelve straight hours. To achieve long-term success, mastering how to measure strategy consistency in trading requires evaluating both market dynamics and personal performance.
Breaking Down the Global Trading Windows
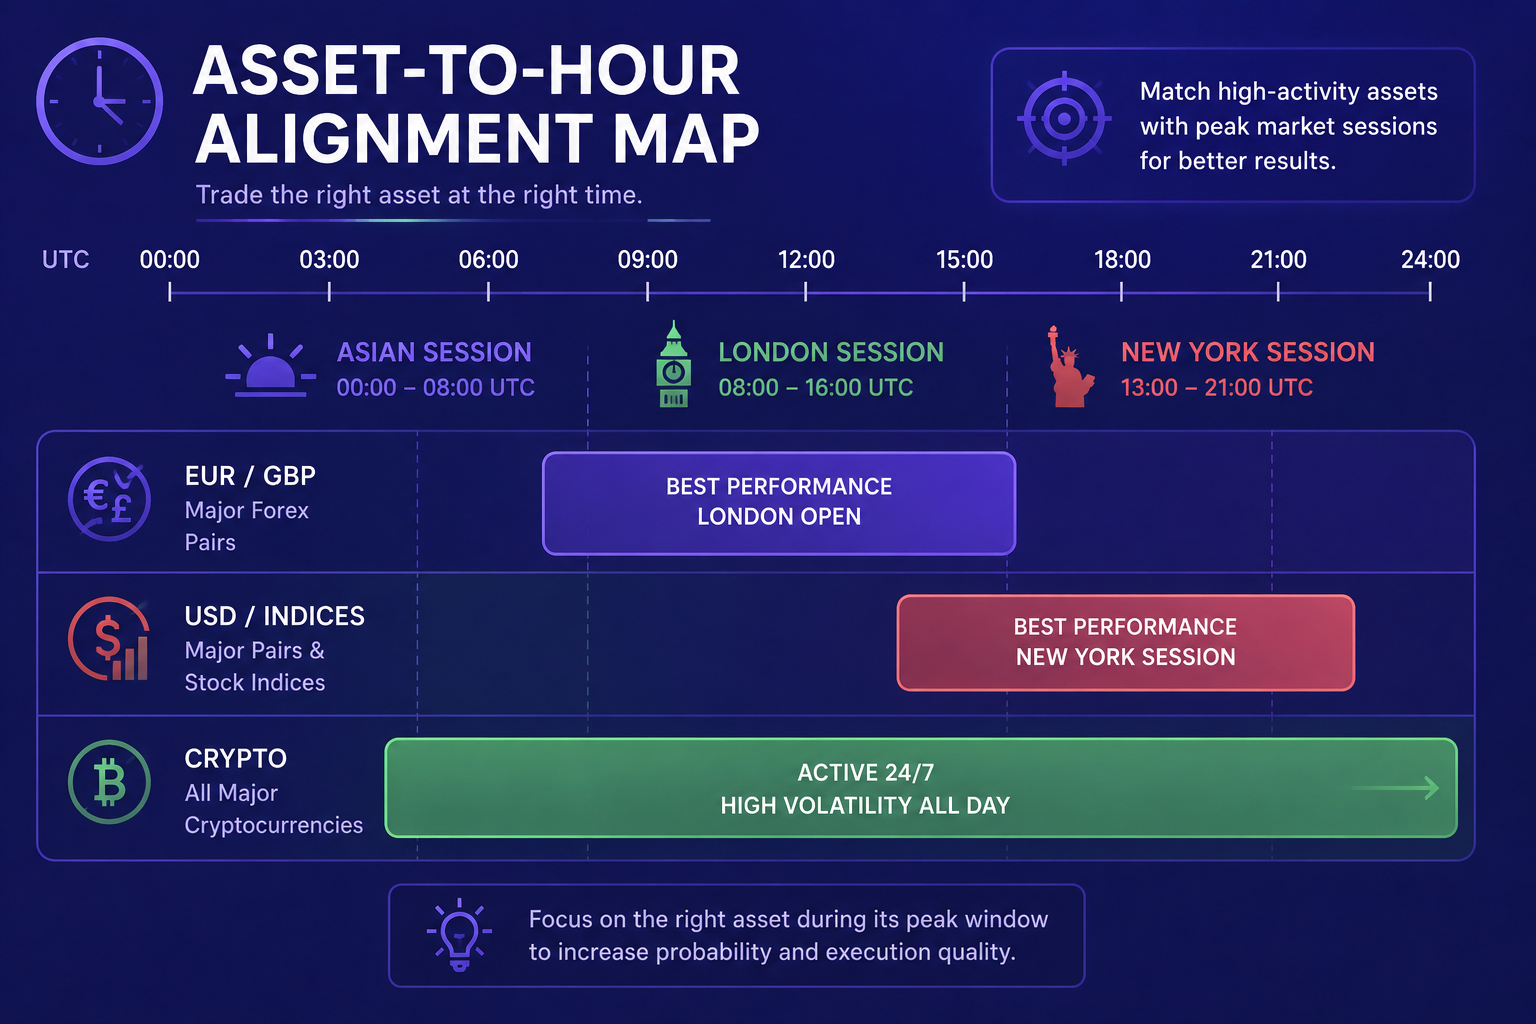
To identify your unique high-probability window, you must match your specific strategy type with the global liquidity map. Financial markets transition through distinct operational blocks each day.
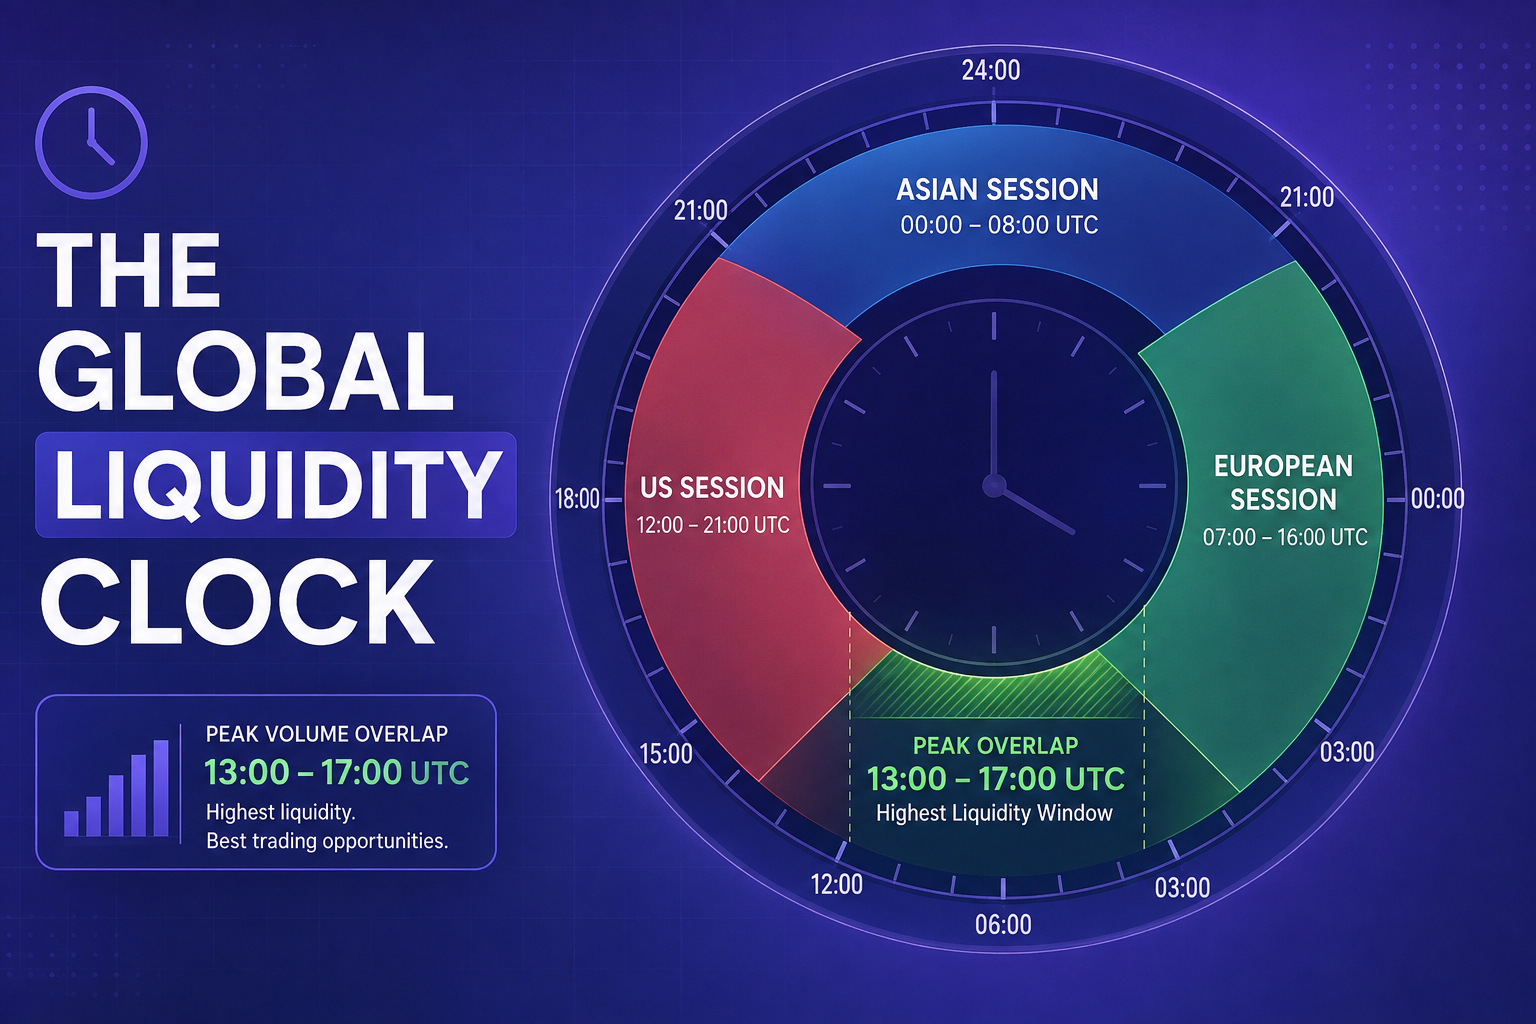
1. The Asian Session (22:00 – 08:00 UTC)
This window is dominated by Tokyo, Sydney, and Singapore. Volatility across major pairs like EUR/USD or GBP/USD generally remains low, oscillating within tight ranges.
- Best For: Mean-reversion scalpers and range-bound traders focusing on JPY, AUD, or NZD pairs.
- The Trap: Attempting to trade breakout strategies on Western currencies. You will suffer constant false breakouts due to insufficient institutional volume.
2. The European Session (08:00 – 16:00 UTC)
As Frankfurt and London open, massive capital flows enter the market. This window regularly sets the primary daily trend for major currency pairs, indices, and commodities like Brent Crude and Gold.
- Best For: Trend-following strategies, momentum breakouts, and news-catalyst plays.
- Platforms & Tools: High-execution environments like Binomo offer access to fast-moving assets during these volatile hours, where rapid order matching is essential for capturing swift trend legs.
3. The London / New York Overlap (13:00 – 17:00 UTC)
This four-hour block is the absolute holy grail of market liquidity. The world's two largest financial hubs are operating simultaneously. Macroeconomic data releases from the United States drop right into this window, generating high volatility and unmatched order depth.
- Best For: All aggressive intraday strategies, high-volume options contracts, index scalping (S&P 500, Nasdaq), and major forex pairs.
- The Advantage: Spreads reach their tightest points of the day, and slippage on top-tier platforms like Pocket Option orQuotex hits near-zero levels due to vast liquidity depth.
How to Conduct Your Personal Time-Audit (Step-by-Step)
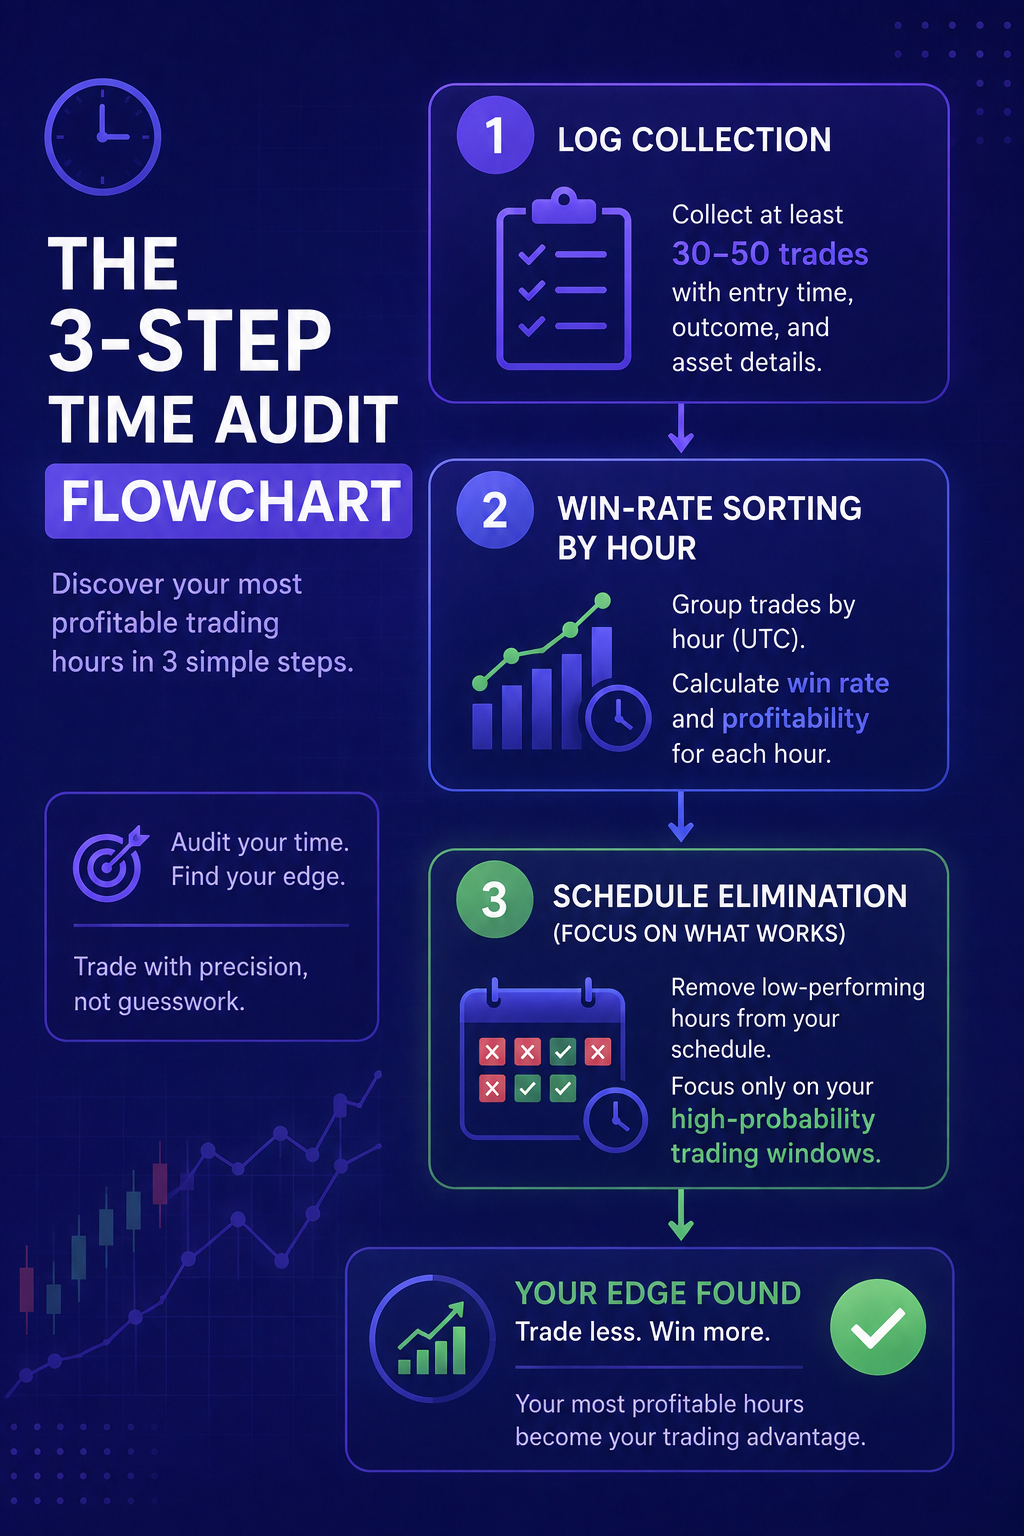
If you want to stop bleeding capital during unproductive market hours, you must perform a systematic audit of your operational data. Here is the precise three-step protocol I used to transform my trading results.
Step 1: Export Your Raw Data
Pull your last 100 to 200 trades from your execution platforms—whether you are using multi-asset terminals like ExpertOption or mobile-focused interfaces like Olymp Trade. Export the raw data into a spreadsheet including execution time (converted to UTC), asset traded, strategy type, and net profit/loss.
Step 2: Categorize by Two-Hour Time Windows
Group your trades into two-hour blocks throughout the day (e.g., 08:00–10:00 UTC, 10:00–12:00 UTC). Calculate three key metrics for each block:
- Win Rate Percentage: (Winning Trades / Total Trades) * 100
- Profit Factor: Gross Profits / Gross Losses
- Average Hold Time: Duration of open exposure
Step 3: Execute the "Cut and Focus" Protocol
When I completed this audit, I discovered that 82% of my net profits came from a narrow two-and-a-half-hour window: 13:30 UTC to 16:00 UTC. The remaining nine hours I spent trading each day were actively erasing my gains.
I immediately instituted a strict rule: I only open execution software during my golden window.
When you restrict your trading to peak hours, your mental energy matches the market's physical momentum. If your schedule requires modern, multi-asset access with deep liquidity during non-standard hours, platforms like Capital Core offer flexible execution tools for international markets.
Integrating Market Regimes and Predictive Signals
Identifying your optimal trading hours is only half the battle. Once you are operating exclusively within high-liquidity windows, you must ensure your directional bias aligns with institutional order flow.
During high-volatility sessions, manual charting alone can leave you vulnerable to institutional liquidity sweeps and fake-outs. This is where combining time-of-day dynamics with predictive market intelligence gives you a decisive edge.
By matching your personal golden trading hours with real-time algorithmic models, you eliminate emotional bias from market entry. Instead of guessing whether a breakout during the London open will sustain its move, you can cross-reference the setup against multi-timeframe forecasts to confirm underlying momentum.
To explore how machine-learning models evaluate directional probability across crypto, forex, and equity markets, check out the live setups on the BeCoin Forecast Hub.
Stop Trading the Clock—Start Trading Your Edge
The fantasy of the 24-hour trader is a trap designed to generate broker commissions at the expense of your retail account balance. Financial markets are not designed to pay you for hours spent sitting in a chair; they pay you for executing high-probability setups with precision.
By auditing your trading history, mapping your strategy to global market liquidity, and cutting out low-performing time windows, you instantly transform trading from an exhausting grind into a streamlined business.
If you are ready to upgrade your trading strategy and stop relying on guesswork, join BeCoin Premium. Get access to institutional-grade analytics, real-time AI market signals, and deep-dive technical insights designed to give you a real, sustainable edge in today's fast-moving markets.
Why Most Deriv Traders Blow Accounts: A Data-Driven Post-Mortem Analysis
The first time I blew a trading account on Deriv, it didn’t happen dramatically. There was no single catastrophic trade. It happened quietly. One loss turned into another. Then I increased the stake to recover the loss. Then the market moved again. Before I realized what had happened, an account balance that took weeks to […]

How Liquidity Affects Day Trading Results
When I first started trading day trading, I believed success was all about finding the perfect indicator. I spent weeks testing moving averages, RSI settings, support and resistance levels, and dozens of YouTube strategies that promised easy wins. Some worked for a few trades, but most failed. What confused me was that the same setup […]

Why Traders Move from Binomo to Deriv in 2026: The Real Reasons Behind the Switch
If you spend enough time around trading communities, you’ll notice a pattern. Many traders start with Binomo. Then, after a few months, a surprising number begin looking at Deriv. Some switch completely. Others keep both accounts but gradually move most of their trading activity to Deriv. I noticed this trend while talking to beginner traders […]

Safest Broker for Small Deposits in 2026
Looking for the safest broker for small deposits in 2026? Discover beginner-friendly trading platforms with low minimum deposits, reliable withdrawals, risk controls, and the best options for starting safely with limited capital. Starting trading with a small amount of money sounds easy until you actually deposit real funds. Most beginners quickly realize that choosing the […]

Deriv vs IQ Option for Synthetic Indices: Which Platform Is Better in 2026?
Synthetic indices have become one of the most talked about trading categories among beginners and experienced traders alike. Unlike forex or crypto markets that depend on real world events, synthetic indices operate 24/7 using algorithm driven price movements. That means traders can access opportunities at any time without waiting for market openings or major news […]